Settings
The Monitoring App view (US or EU) allows for easy interaction between various App settings.
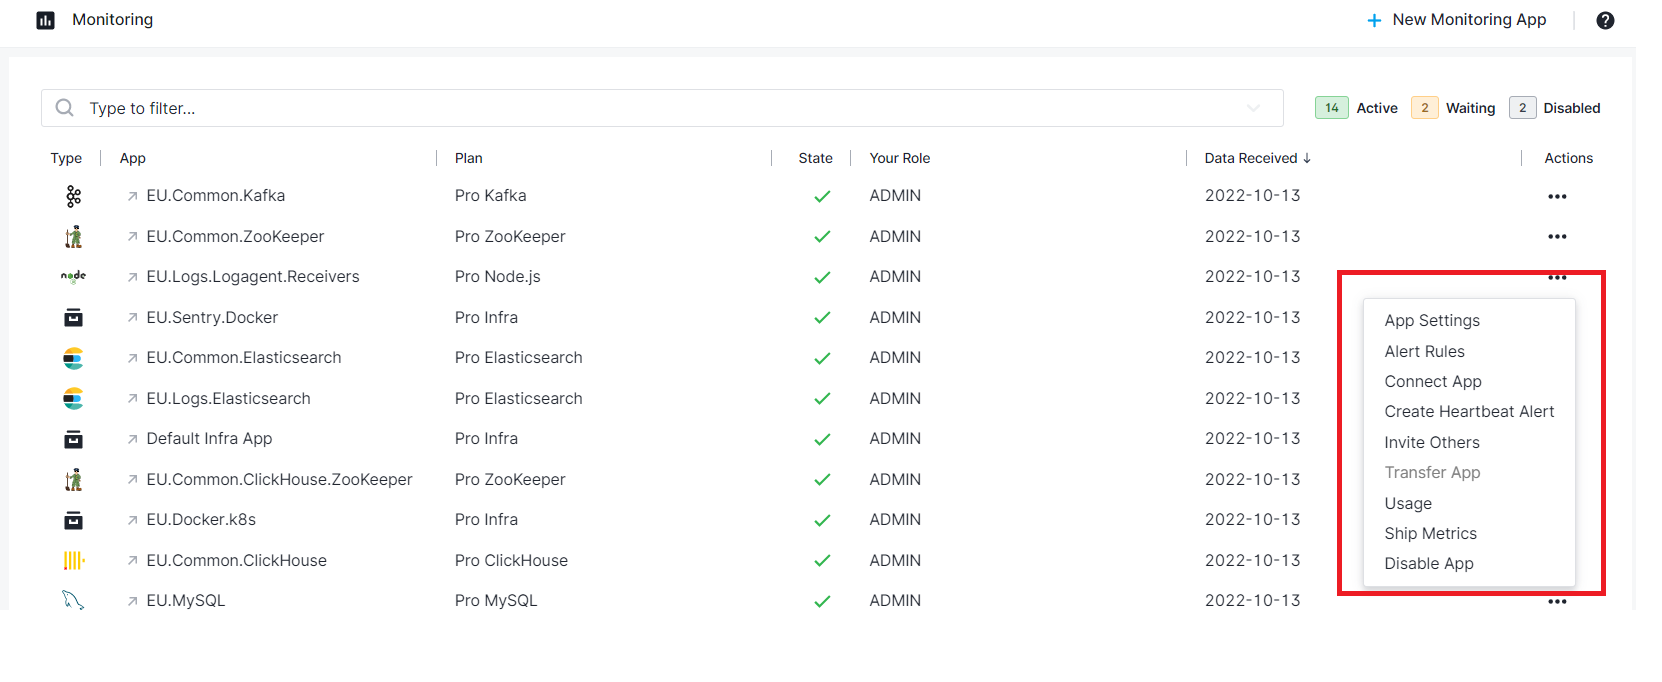
From the App Actions drop down menu, the horizontal elipsis icon (⋯) shows your App options and lets you open various App-specific functions:
- inviting others to your App
- alert rules
- changing your App's plan
- connecting Apps
- heartbeat alert creation
- App ownership transfer
- scheduled report emails
Side Navigation
The left navigation menu provides access to all primary product areas and features, organized into functional categories. When you click on Monitoring under Observability Suite section, you will see a list of your Service Monitoring and Infrastructure Monitoring Apps. Selecting any Monitoring App opens a contextual sub-menu that contains actions and sections specific to that Monitoring App.
Sub-level sections for a Service Monitoring App include:
Reports
Provides out-of-the-box reports based on the selected integrations. You can also use the + Add Report button to create custom reports tailored to your Service Monitoring App.
Alerts
The Alerts. section shows recently triggered alerts for your Service Monitoring App. It also includes Alert Rules, where you can view, manage, and create new alert rules to get notified based on thresholds, or anomalies.
Setup & Configuration
This section contains all options for shipping metrics to your Monitoring App, including:
- Installing the Sematext Agent on additional hosts
- Configuring metrics shipping from discovered metrics on existing hosts without additional installation
It also includes:
- Agent Fleet – A centralized view of all the Sematext Agents installed throughout your infrastructure.
- App Settings – Configure App level settings such as retention, data access, integrations, and general preferences.
Tools & Resources
- Custom Dashboards – Build and manage dashboards to visualize and aggregate your metrics using the Chart Builder.
- Troubleshooting – Tools and guidance to help diagnose log ingestion issues.
- Documentation – Direct access to relevant documentation, guides, and examples for working with your Monitoring App.
Report Settings
Once you create a Monitoring App, and start your Agent, it will have a set of default reports and components. You can edit, clone and delete these reports or create new ones. You can also define report variables to dynamically fiter and group data in a report.

Based on what type of Monitoring Integration you chose, more reports get created by default. In this OpenSearch integration you can see three more reports are created by default.