HTTP Monitor
The HTTP monitor sends a single HTTP request with its configured request settings to the specified URL. It records the response data like headers, body, error if any and the various timings.
Configuration
General
- Name - Name of the monitor. Max length is 255 characters.
- HTTP Method - HTTP Method.
- URL - URL of the HTTP monitor of format
<http(s)>://hostname:port/path. - Interval - Monitor execution interval. Supported intervals are 1m, 5m, 10m, 15m.
- Consecutive Runs - Reruns the monitor immediately after a failure, with the option to retry up to five times before marking the run as failed, thus preventing intermittent issues from producing false positive alerts or affecting monitor availability.
- Locations - List of locations to run the monitor.
- Scheduled Monitor Pauses - Specify one or more time periods a monitor should be paused
Advanced Settings
Request Settings
- Authentication - Fetch token for each run and pass it in your API requests, or pass username and password to connect to your protected APIs.
- Headers - List of HTTP headers to be sent.
- Query Params - List of request query parameters to be appended to the URL.
- Cookies - List of Cookies to be sent.
- Body - Request body data. Max length is 4096 characters.
Optionally, the Header, Query Params, and Cookies values can be marked as hidden, which means it will be hidden for the users. Currently, we do not encrypt the hidden values while storing it in the DB.
The max length of the Header, Query Params, and Cookies name and value fields are 512 and 1024 characters respectively. A maximum of 100 entries for each is allowed.
By default, the HTTP monitor adds the headers below for all requests sent from the agent:
| Name | Value | Description |
|---|---|---|
x-sematext-origin |
synthetics |
Origin of the request. Can be used to identify Synthetics requests in the back end or filter the requests in a firewall. |
x-sematext-synthetics-id |
<run-id> |
Uniquely identifies this request. Can be used for tracing and correlation in the back end. |
Response Settings
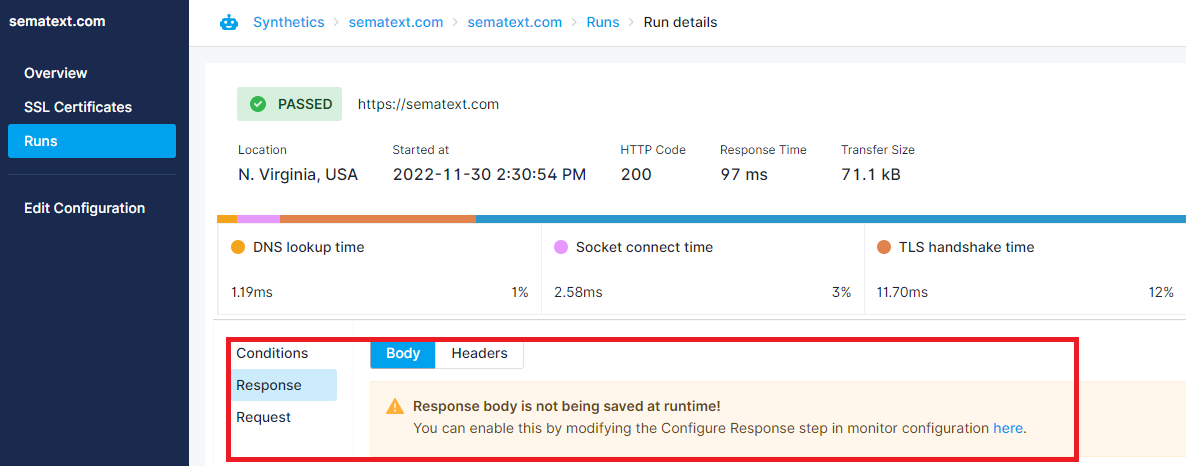
- Save Response Body - Disable this option to prevent response body from being saved at runtime. This can be helpful to ensure no sensitive data gets featured in your test results.
If you disable this option, we won’t save the response body hence it will not be shown on the Run details screen.
Bulk Adding HTTP Monitors
When creating an HTTP Monitor, you can add multiple URLs at once. All configuration settings specified during the creation process will be applied to URLs added in bulk. To add URLs individually, click the '+ New Monitor' button for each one.
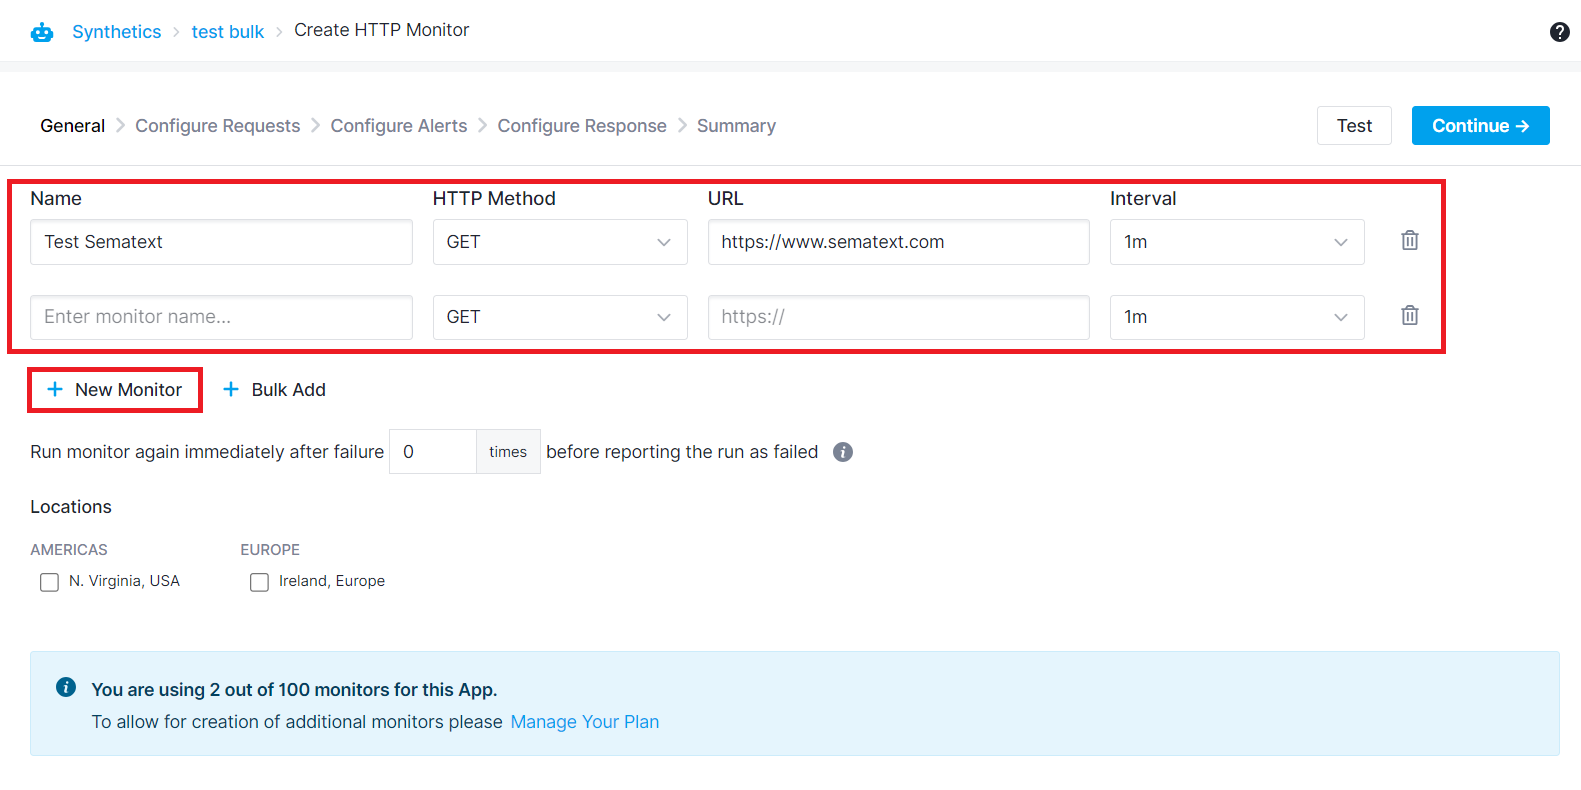
Alternatively, click the '+ Bulk Add' button. A pop-up will appear, allowing you to paste the list of URLs. Ensure each URL is separated by a new line within the pop-up. This enables you to add numerous endpoints for monitoring without the need to input each one individually.
Authentication
To monitor pages protected by some form of authentication each monitor can be configured to use one of the following types of authentication.
Bearer / Access Token
You can dynamically fetch a token for each run with token support and pass that token in your API requests.
When creating an HTTP monitor, expand the Show Advanced Settings and navigate to the Authentication tab and select Bearer/Access Token authentication option.
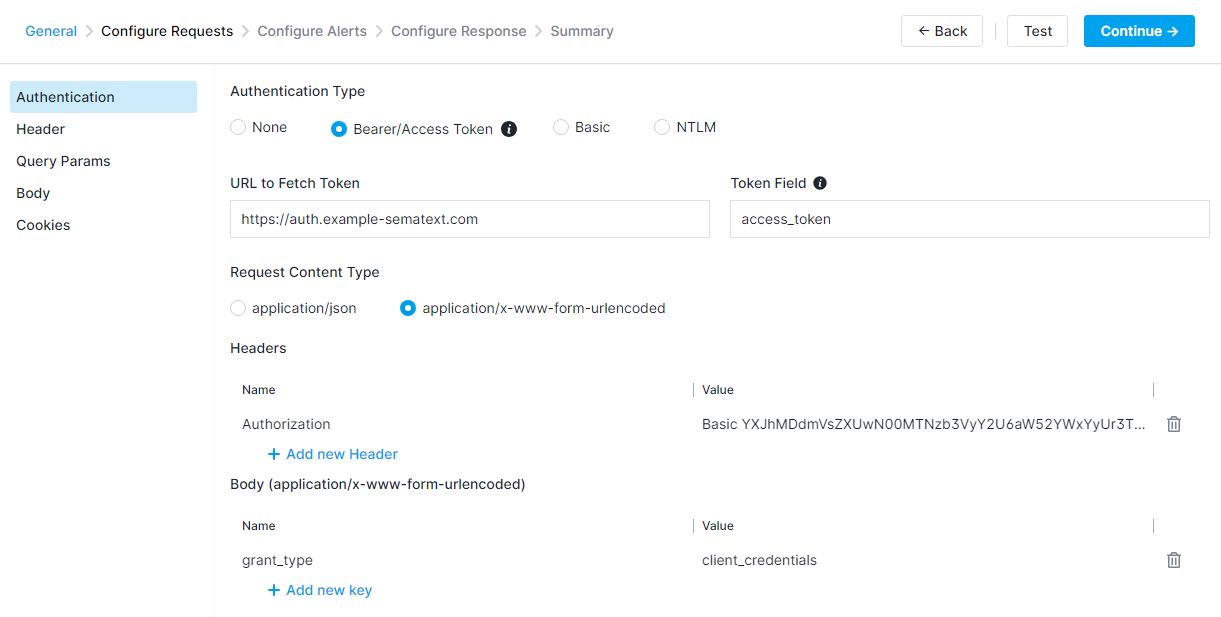
Enter the access token URL and the source field to get the token from the response. Enter headers and body parameters to fetch the token such as grant_type, username and password. We currently support encoding the authentication request's body as application/json and application/x-www-form-urlencoded.
Before Sematext calls the endpoint, an access token will be fetched based on the parameters entered within this tab and it will be passed to the API request.
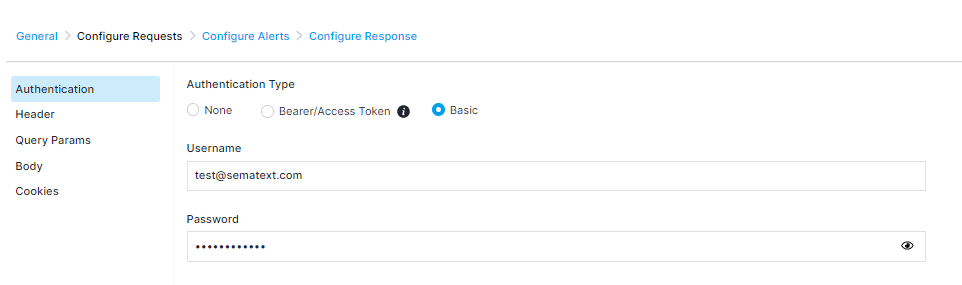
Basic Authentication
You can select the Basic Authentication option within the Authentication tab and add the username and password needed to connect to your protected APIs.
NTLM Authentication
You can select the NTLM Authentication option within the Authentication tab and enter your credentials. Both NTLMv2 and NTLMv1 are supported.
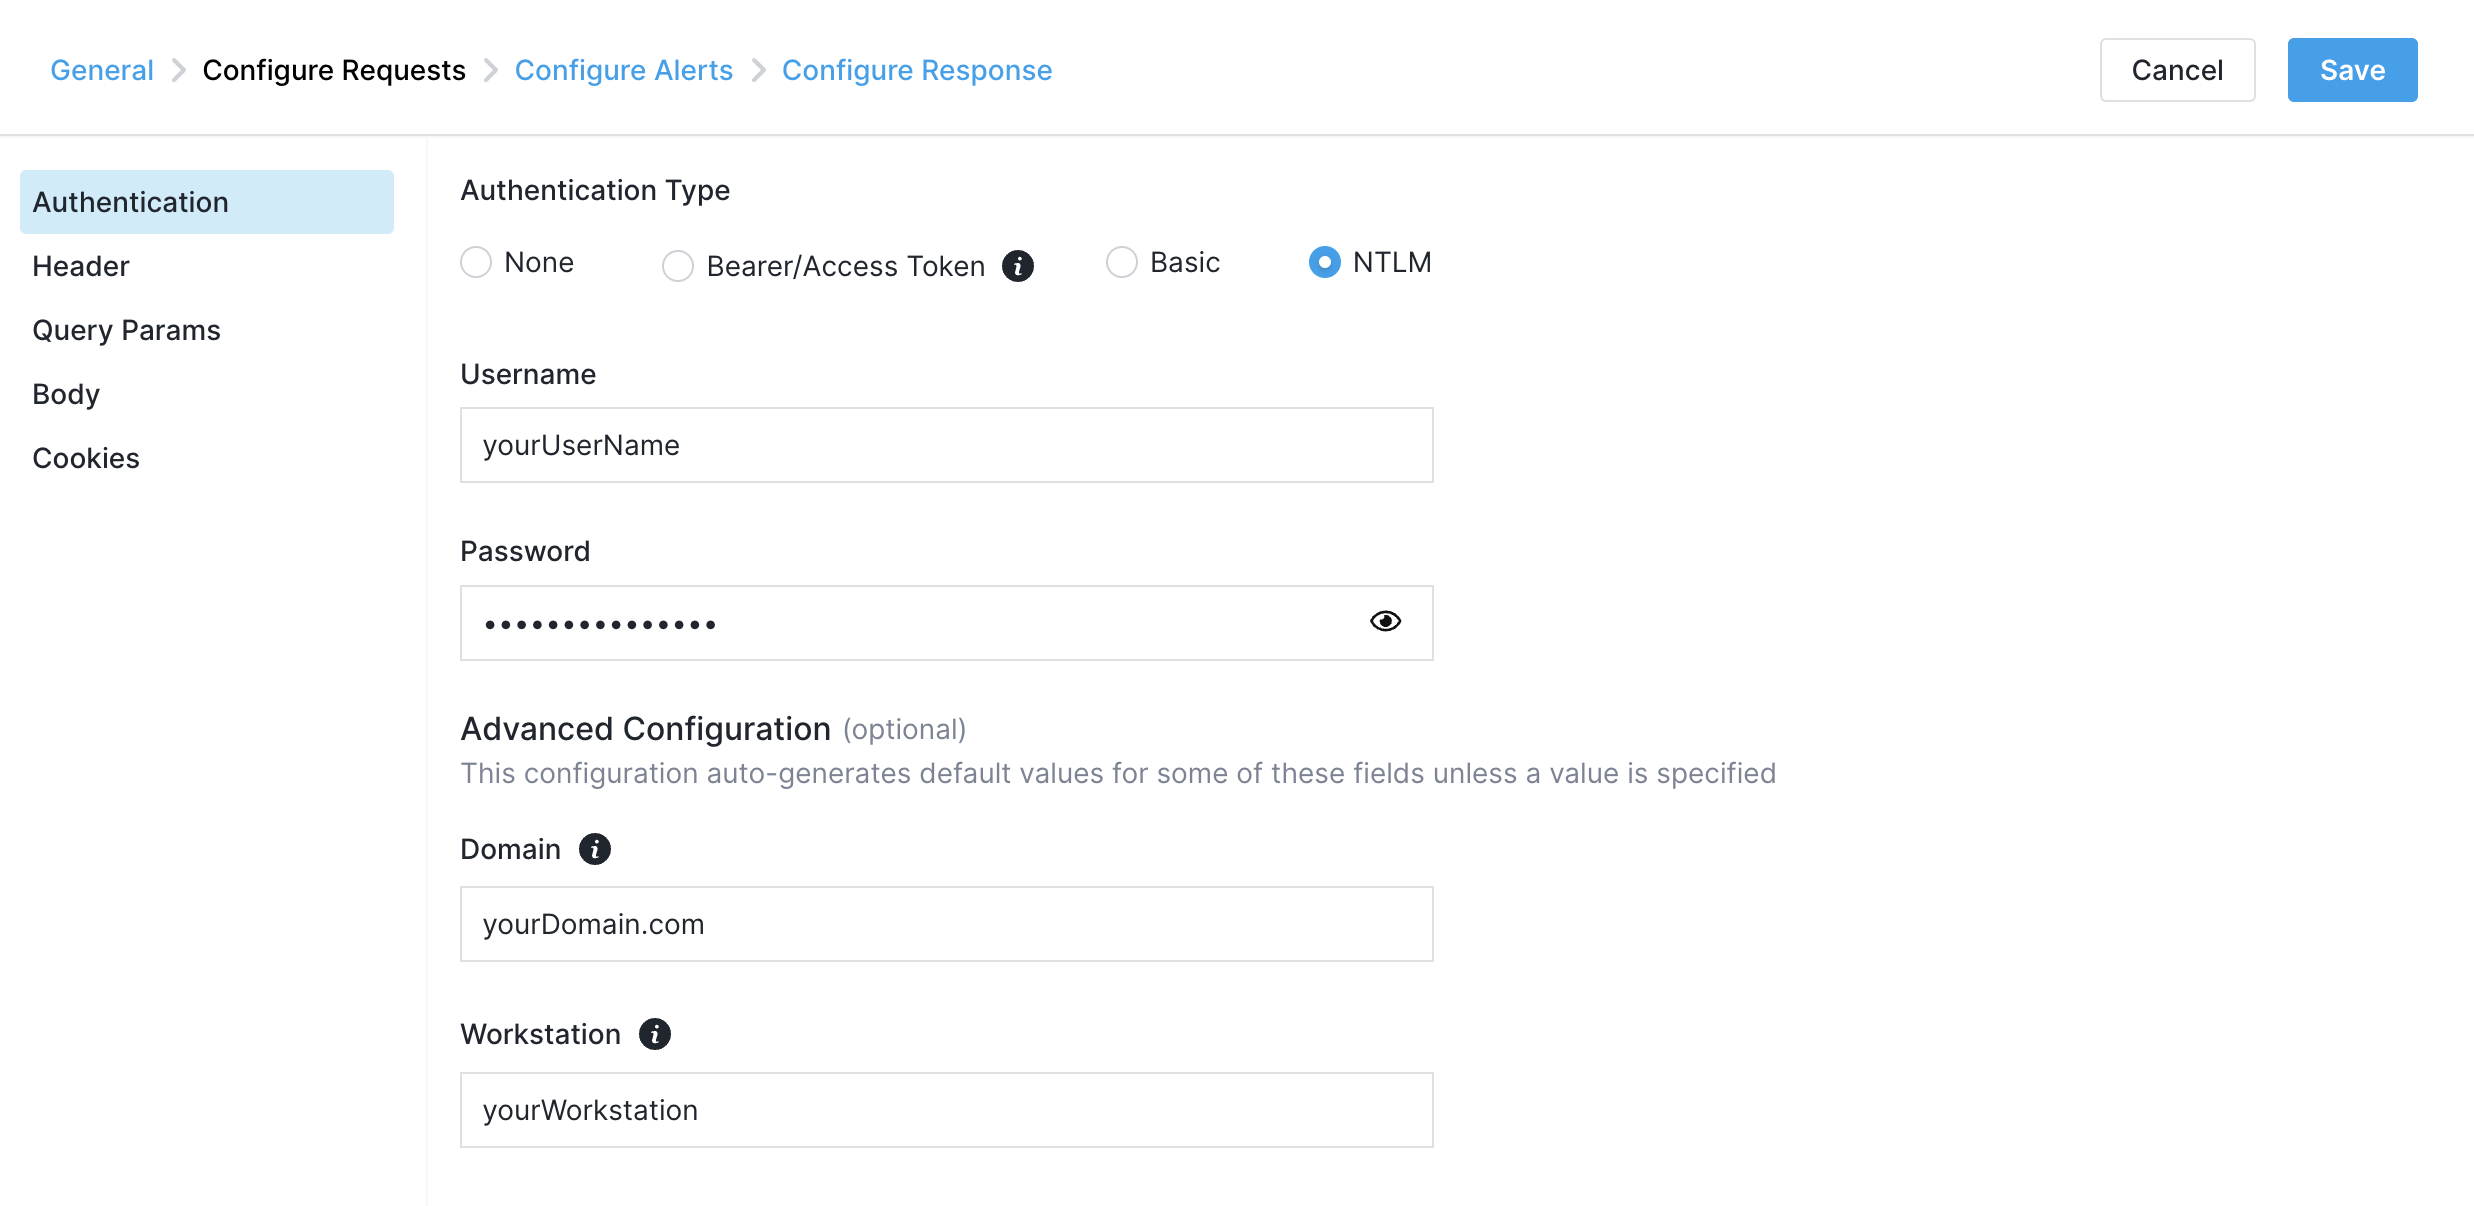
You can also fill in the optional Domain and Workstation fields in the Advanced Configuration section, if those are required for your setup. If no advanced configuration is specified, default empty values will be auto-generated.
Header-based Authentication
HTTP monitors also support header-based authentication. You can specify custom HTTP request headers when creating a monitor.
For instance, if you need to monitor an endpoint using an API key, you can include it as a custom request header, like so:
| Name | Value |
|---|---|
API_KEY |
XYZ |
For Basic authentication using only headers, follow these specifications to add a custom request header:
| Name | Value | Description |
|---|---|---|
Authorization |
Basic XYZ |
XYZ is the Base64 encoding of the username:password string. |
After Base64 encoding the string username:password above would become dXNlcm5hbWU6cGFzc3dvcmQ=. This is then prepended with Basic to get the final Authorization header value of Basic dXNlcm5hbWU6cGFzc3dvcmQ=.
So if your username was username and your password was password, then your Authorization header would look as follows:
| Name | Value |
|---|---|
Authorization |
Basic dXNlcm5hbWU6cGFzc3dvcmQ= |
It is possible to get the Base64 encoded value of your username and password by using the following command in a terminal, where you should replace username with your username and password with your password:
You can also get the Base64 encoded value of your username and password by using an online Base64 encoder/decoder such as base64encode.org.
Conditions
Alert conditions can be configured on the response fields and metrics. The conditions are evaluated for every run result. All the conditions should pass for a run to be declared as passing. If any condition fails, the run will fail and the monitor will be marked as failing. The supported alert condition types for HTTP monitors are:
- Error - During each run, if there's an error like connection, timeout, etc., it will be recorded in the error field of the response. This does not include the error returned as part of the response body.
- Response Code - HTTP Status Code. Used to make sure the response code should be of specific value or range.
- Metric - Used to make sure the metrics are within the expected range.
- Response Header - Can be used to compare the value of a specific header field against the expected value.
- Response Body - Compare the response body against the specified value using an operator.
- Response Body JSON - If the response body is JSON, JSONPath can be used to extract a specific value and compare against the expected value. More information on how to set up these conditions is provided in the next subsection.
Various operators like Equals, Less Than, Greater Than, Contains are supported based on condition type. These conditions define the alert rule for your monitor. You can choose the priority of the alert rule right below the table where the alert conditions are edited. The default priority for HTTP monitor alert rules is Warning. For more information on alerting, refer to the Creating Synthetics Alerts page.
By default, the UI adds the below conditions while creating an HTTP monitor. You can change them during the creation:
- Error equals empty
- Response Code equals
200 - Response Time metric less than 20000 ms
Configuring Custom Alerts based on JSON response
In addition to our preconfigured alert conditions, you can also create your own based on the JSON returned in the response body. This can be done using the Response Body JSON type, where JSONPath can be used to extract a specific value and compare it against the expected value.
Let's say that you have an API which returns information about the internal status of your services. When everything is working fine, this is the response you get:
{
  "results":[
    {
      "name":"Database",
      "status":"OK"
    },
    {
      "name":"Redis",
      "status":"OK"
    },
    {
      "name":"Elasticsearch",
      "status":"OK"
    }
  ],
  "serviceStatusCode":"0"
}
In the event where one of the services encounters issues, its status will change from OK to Error, like so:
{
  "results":[
    {
      "name":"Database",
      "status":"OK"
    },
    {
      "name":"Redis",
      "status":"Error"
    },
    {
      "name":"Elasticsearch",
      "status":"OK"
    }
  ],
  "serviceStatusCode":"2"
}
With this JSON structure in mind, you can define a Response Body JSON alert condition like in the image below.
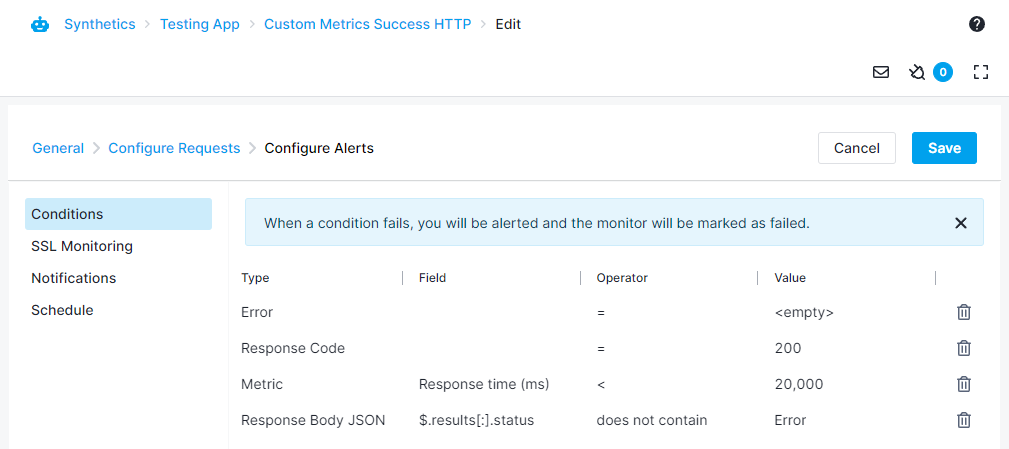
The field is defined as $.results[:].status, meaning that all the status fields inside of results will be checked, and the monitor run will fail if any of them are equal to Error. Here's an example of a run failing upon one of these services reporting an error.

Run environment
Each HTTP monitor run is executed in an isolated environment. Go HTTP Client library is used to execute the HTTP requests. Each run is allocated 128MB memory. The response body is trimmed to 2 MB.
The default values for various timeouts are:
- Socket Connection Timeout - 10 seconds.
- TLS Handshake Timeout - 10 seconds.
- Total Timeout - Timeout for complete request-response operation - 25 seconds.