IDE Integration and Debugging
Logagent Debugging with Visual Source Code:
Here we try explain how to debug Logagent using Visual Source
Code. After downloading VSC
and importing Logagent project, you can debug Logagent configuration
with launch configuration like this - you'll want to adjust the path
below, obviously:
{
    "version": "0.2.0",
    "configurations": [

    {
        "type": "node",
        "request": "launch",
        "name": "logagent",
        "program": "${workspaceFolder}/bin/logagent.js",
        "args": [
            "-c",
            "/Users/fbalicchia/Projects/logagent-js/config/examples/gelf-stdout.yml",
            ""
        ],
        "console": "externalTerminal"
    }
    ]
}
"console": "externalTerminal" lets you open an external console for stdin/stdout in case your Logagent configuration uses console plugin.
Example :
Say we are trying to pinpoint a problem in GELF Input Plugin. We can add a breakpoint in GELF Input Plugin on the event message:
s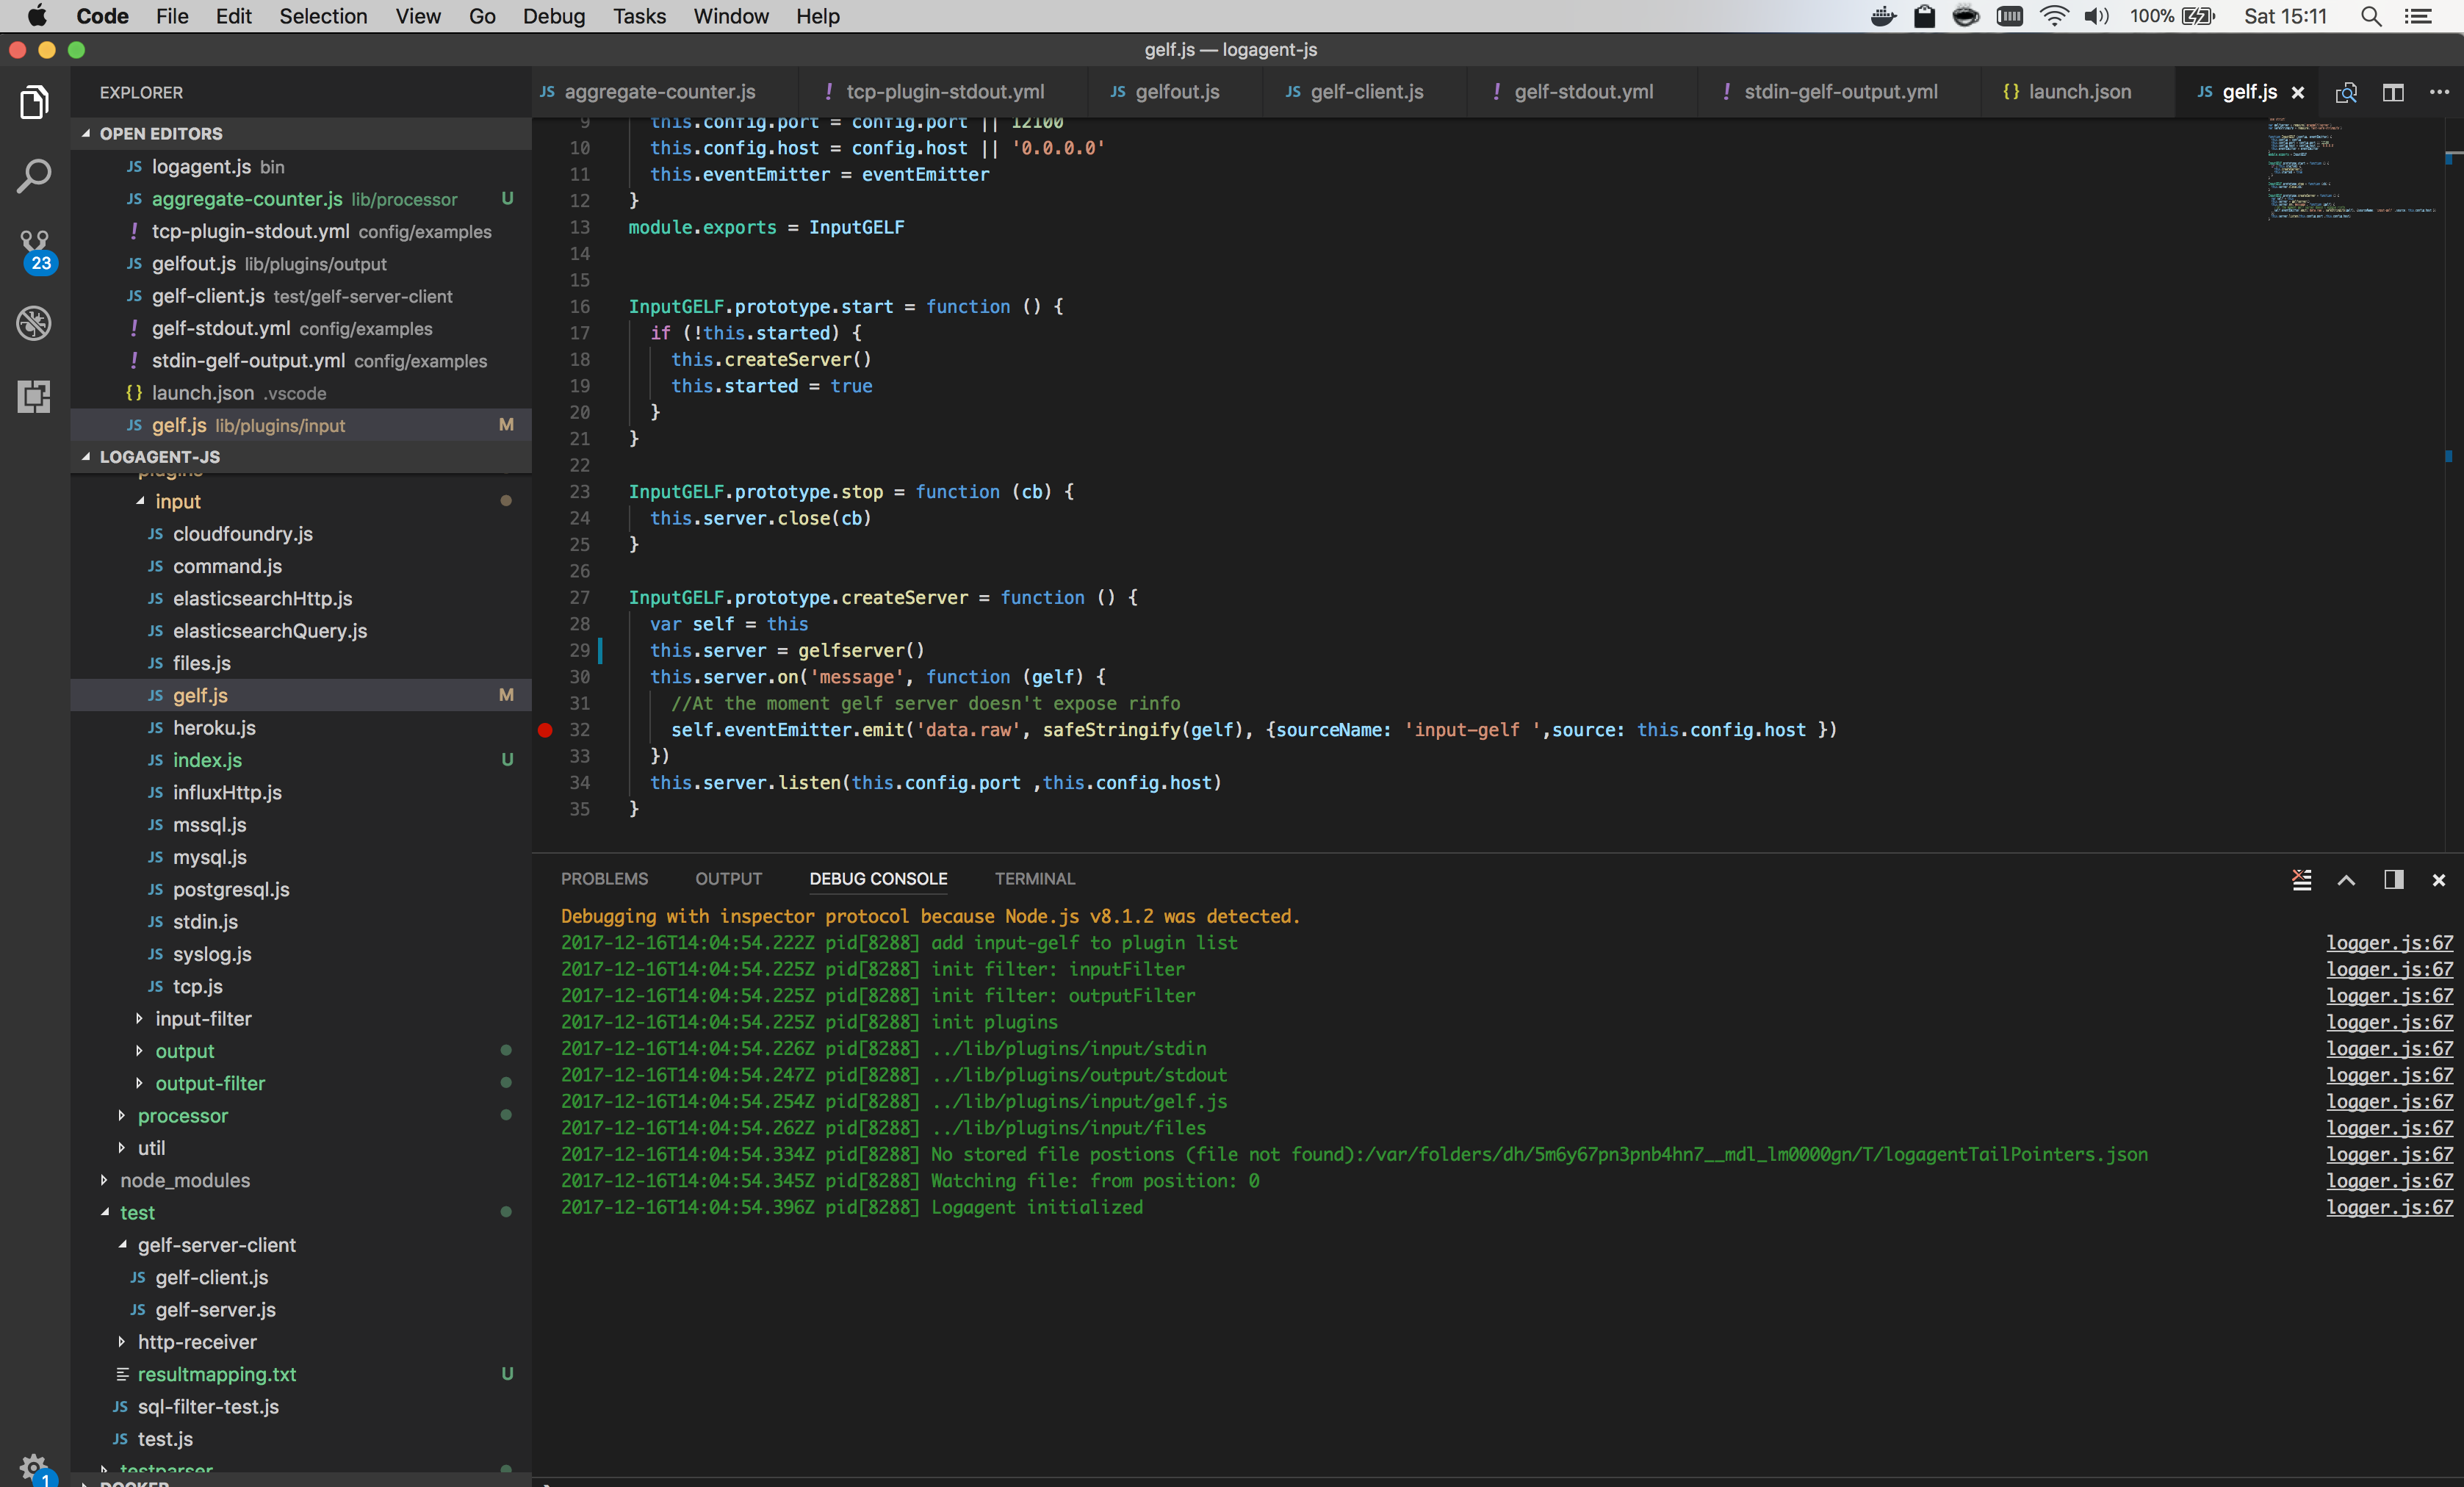
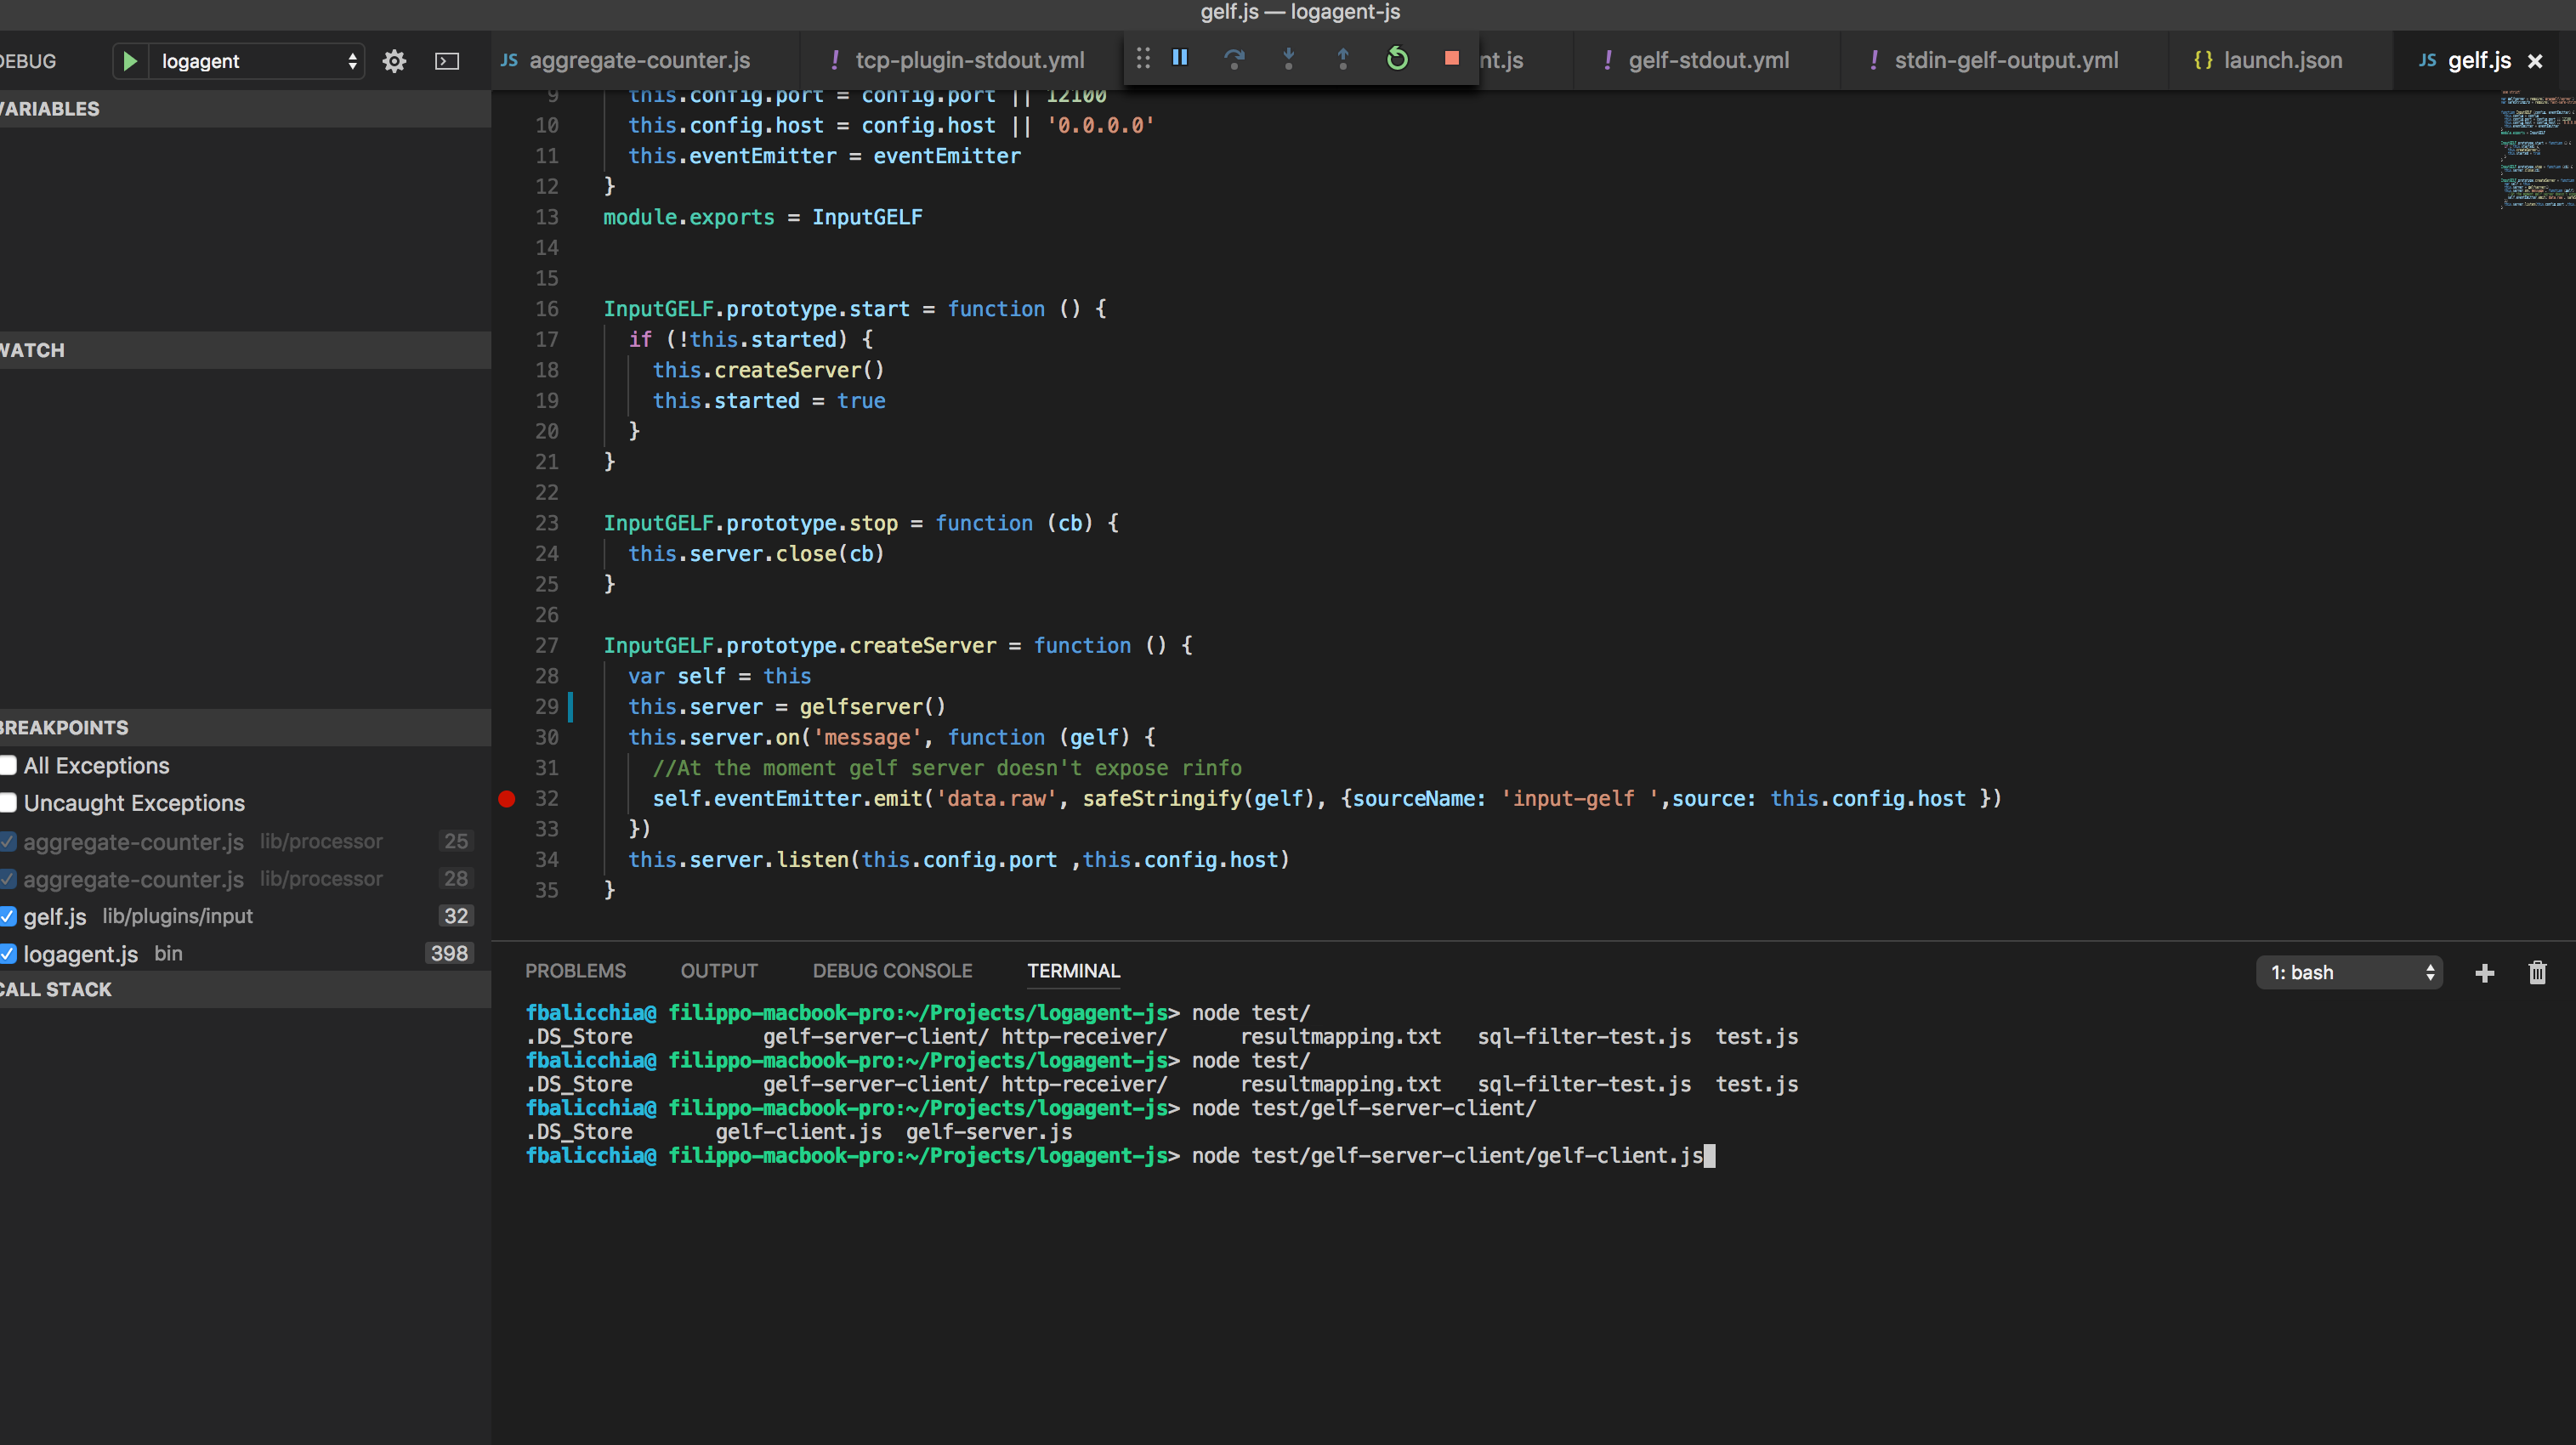
Next, we need to produce a message from a GELF client. We could do that by typing in the terminal:
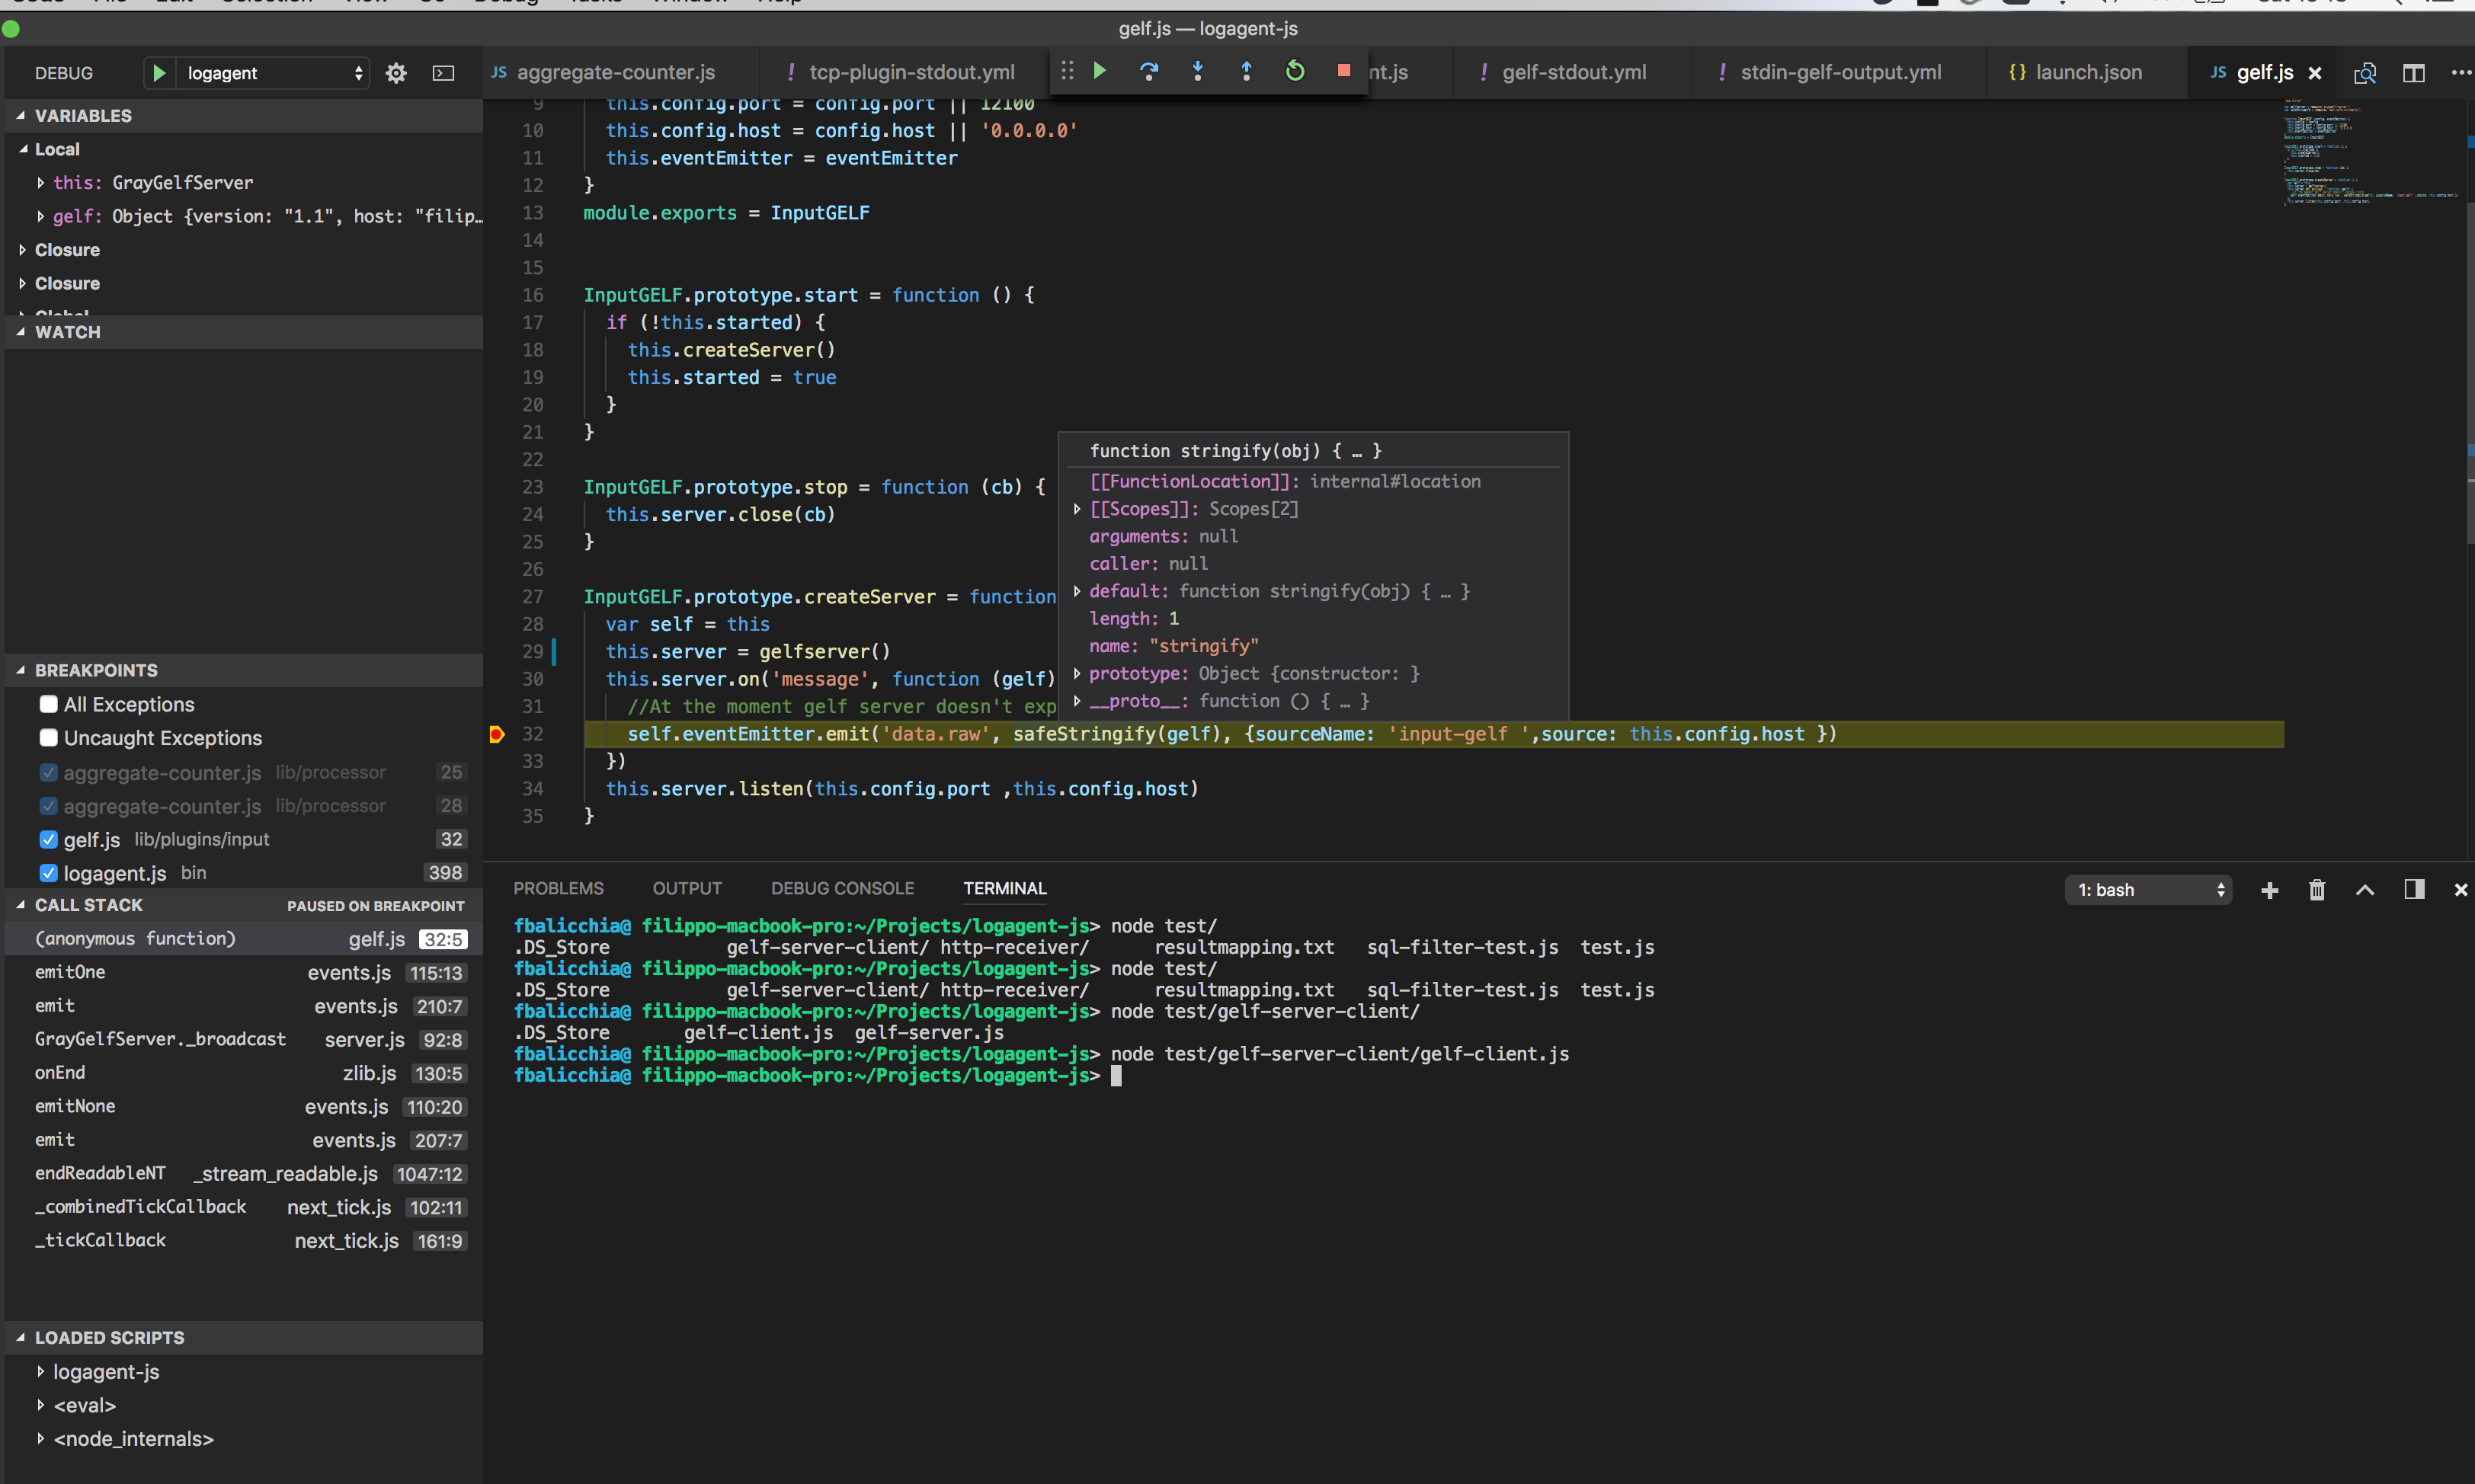
Logagent will stop at our breakpoint and we can then start to debug:
Useful Plugins to install:
Visual Source Code provides a lot of plugins, including ESLint, which helps keep the code more consistent and easier to debug.