Node.js
Sematext offers a simple Node.js monitoring agent, written entirely in Node.js without CPU and memory overhead. It's easy to install and require in your source code.
Sematext Node.js Monitoring Agent Quick Start
This lightweight, open-source Node.js monitoring agent collects Node.js process and performance metrics and sends them to Sematext. It is available as an npm package that can be added to JavaScript source code like any other Node.js module.
First you install the npm module.
You need to add the MONITORING_TOKEN of your Sematext Monitoring App to your Node.js process environment with a module like dotenv, or directly before running the application. If you want to collect process-specific metrics as well, add the INFRA_TOKEN.
Require it in your source code at the top if your source file.
// app.js
// load env vars if you're using dotenv
require('dotenv').config({ path: '/absolute/path/to/your/project/.env' })
// start agent
require('spm-agent-nodejs')
Run your source file.
Or without dotenv.# Terminal
MONITORING_TOKEN=<your-monitoring-token-goes-here> \
INFRA_TOKEN=<your-infra-token-goes-here> \
node app.js
The Sematext Node.js monitoring agent will start collecting dozens of key metrics right away, and start showing you the performance and health of your Node.js applications immediately.
Sematext Node.js Monitoring Agent Configuration
The Sematext Node.js Monitoring Agent uses environment variables or the RC NPM Package for configuration. This means configuration parameters can be passed via several locations, command-line arguments, or environment variables.
We recommend to either use dotenv or an rc file in the current directory in YAML format called .spmagentrc.
Configuration with environment variables
You can either use dotenv or export the environment variables.
Depending on which region of Sematext Cloud you are using you need to set the receiver URLs accordingly. The US region is used by default. In case you are using the EU region, set the receiver URLs like this:
# Changing API endpoints for Sematext Cloud EU
export SPM_RECEIVER_URL=https://spm-receiver.eu.sematext.com/receiver/v1
export EVENTS_RECEIVER_URL=https://event-receiver.eu.sematext.com
Here's a list of all available environment variables if you ever need to configure them:
export MONITORING_TOKEN=<your-monitoring-token-goes-here>
export INFRA_TOKEN=<your-infra-token-goes-here>

# default receiver URLs are the US region of Sematext Cloud
# URLs need to be changed for EU and Enterprise
export SPM_RECEIVER_URL=<your-spm-receiver>
export EVENTS_RECEIVER_URL=<your-event-receiver>

export SPM_DB_DIR=/tmp
export SPM_LOG_DIRECTORY=./logs
export SPM_LOG_LEVEL=error
export SPM_LOG_TO_CONSOLE=true
export HTTPS_PROXY=<your-proxy-server>
Configuration with .spmagentrc
This file can be generated by providing setting and environment variable and calling a helper script:
export MONITORING_TOKEN=<your-monitoring-token-goes-here>
export INFRA_TOKEN=<your-infra-token-goes-here>
node ./node_modules/spm-agent-nodejs/bin/spmconfig.js
The command above generates following default configuration file in YAML format:
# Directory for buffered metrics
dbDir: ./spmdb

# Monitoring App Token
tokens:
  monitoring: <your-monitoring-token-goes-here>
  infra: <your-infra-token-goes-here>

logger:
  # log file directory default is ./spmlogs
  dir: ./spmlogs
  # silent = true means no creation of log files
  silent: false
  # log level for output - debug, info, error, defaults to error to be quiet
  level: error
The only required setting is the Monitoring Token.
If you want to use the EU region then you need to add two more values:
# Directory for buffered metrics
dbDir: ./spmdb

# Monitoring App Token
tokens:
  monitoring: <your-monitoring-token-goes-here>
  infra: <your-infra-token-goes-here>

# default receiver URLs are the US region of Sematext Cloud
# URLs need to be changed for EU
spmSenderBulkInsertUrl: https://spm-receiver.eu.sematext.com/receiver/v1
eventsReceiverUrl: https://event-receiver.eu.sematext.com

logger:
  # log file directory default is __dirname / spmlogs
  dir: ./spmlogs
  # silent = true means no creation of log files
  silent: false
  # log level for output - debug, info, error, defaults to error to be quiet
  level: error
Both using environment variables or the .spmagentrc file is valid. Use whatever you prefer.
Collected Node.js Metrics
The Sematext Node.js Monitoring Agent collects the following metrics.
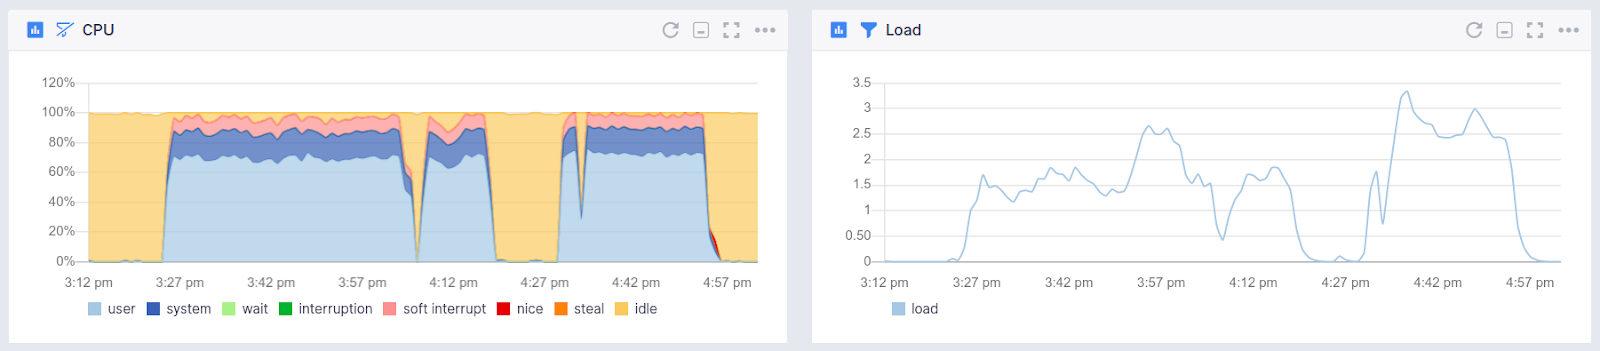
Operating System
- CPU usage
- CPU load
- Memory usage
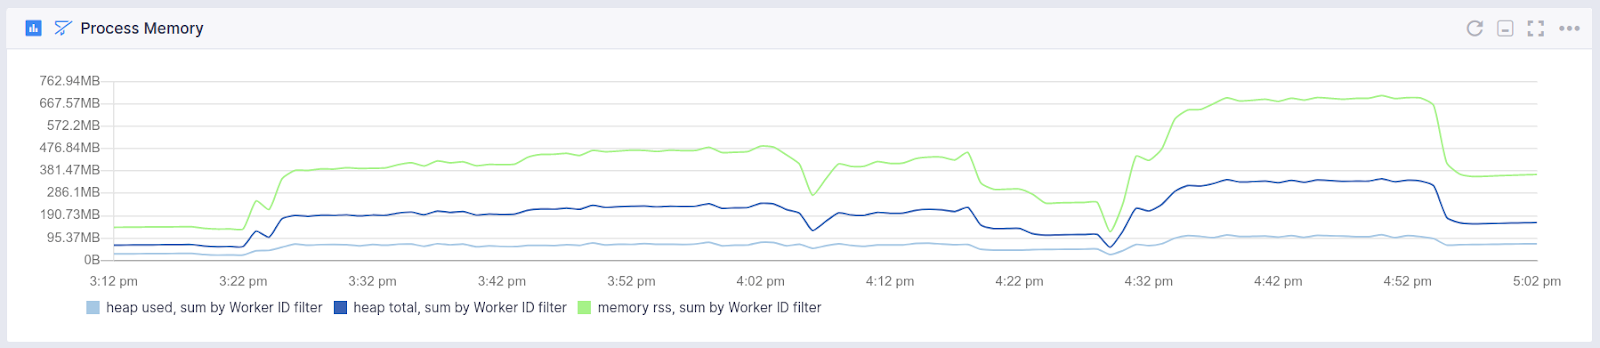
Process Memory Usage
- Released memory between garbage collection cycles
- Process heap size
- Process heap usage
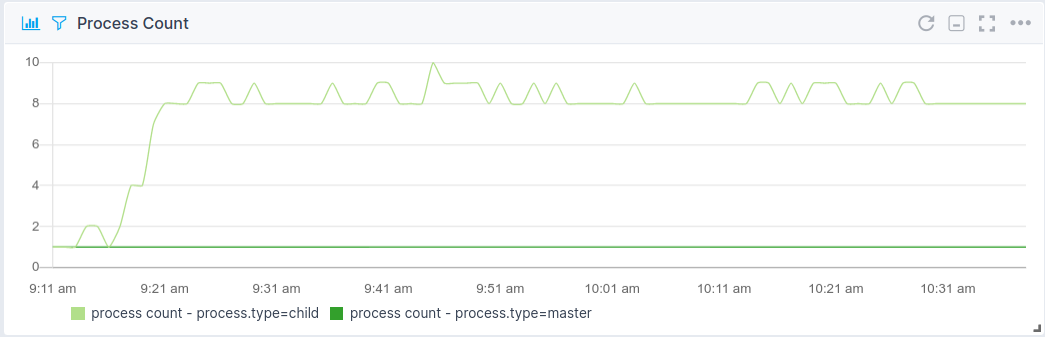
Process Count
- Number of master processes
- Number of child processes
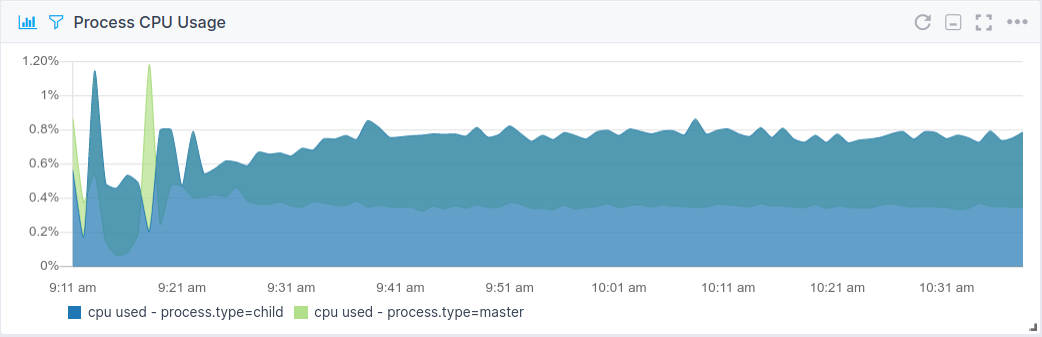
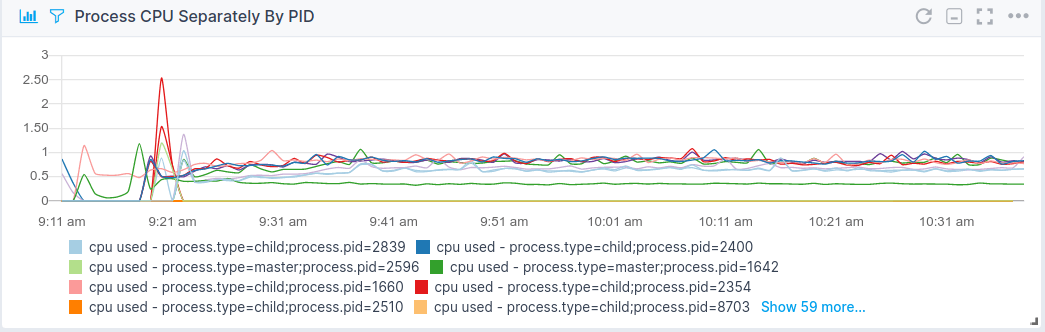
Process CPU Usage
- CPU usage per process
- CPU usage per PID
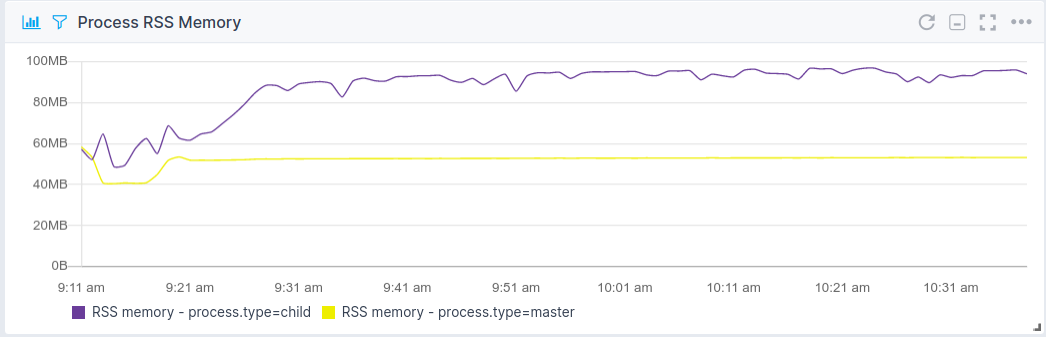
Process RSS Usage
- RSS usage per process
- RSS usage per PID
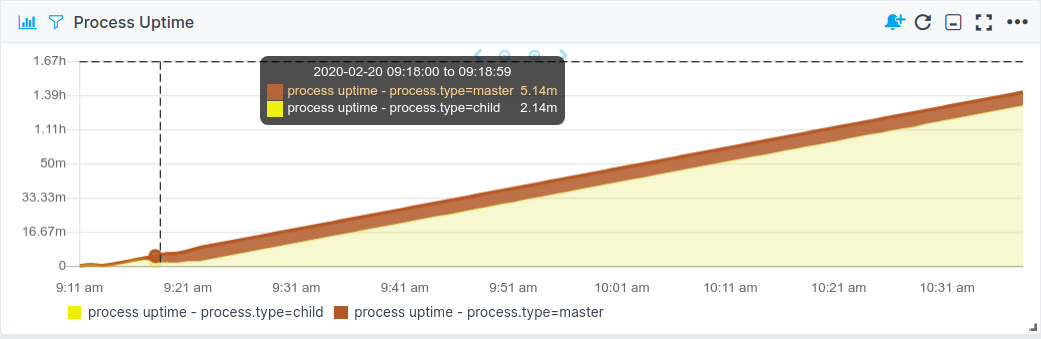
Process Uptime
- Process Uptime per process
- Process Uptime per PID
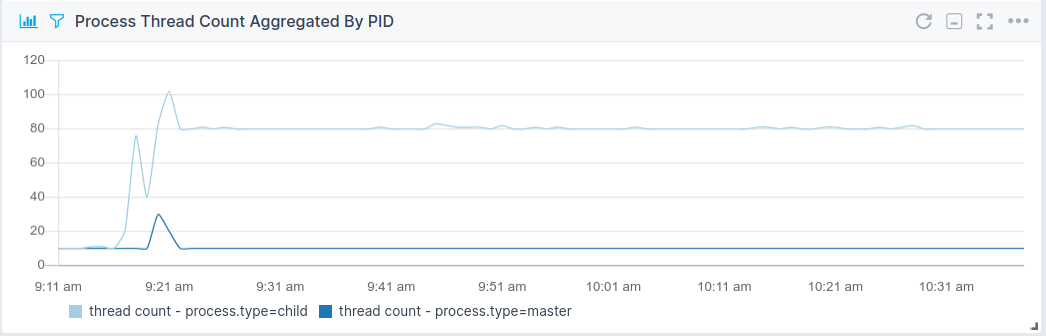
Process Thread Count
- Number of threads per process
- Number of threads per PID
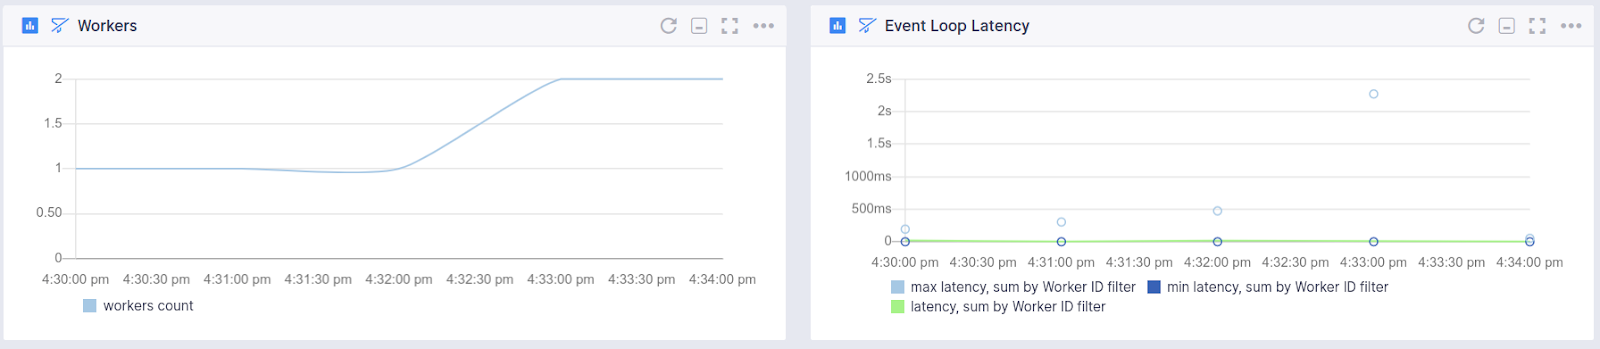
Worker Processes (cluster module)
- Worker count
- Event loop latency per worker
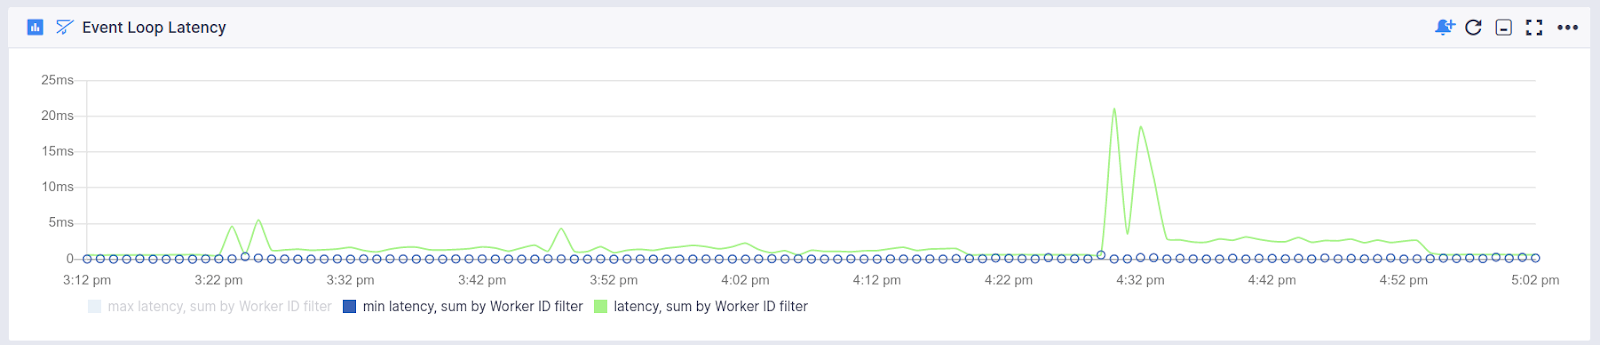
Event Loop
- Maximum event loop latency
- Minimum event loop latency
- Average event loop latency
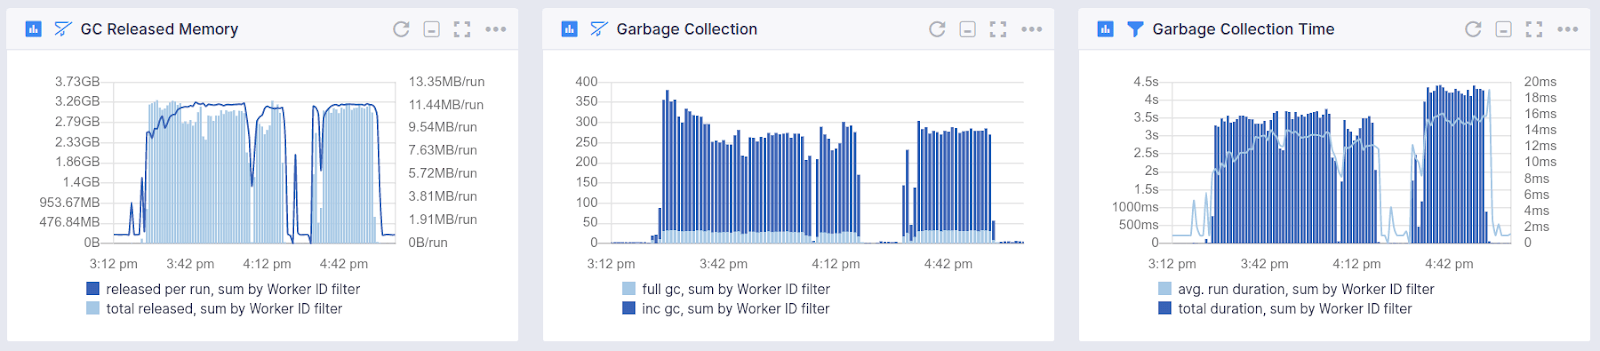
Garbage Collection
- Time consumed for garbage collection
- Counters for full garbage collection cycles
- Counters for incremental garbage collection cycles
- Released memory after garbage collection
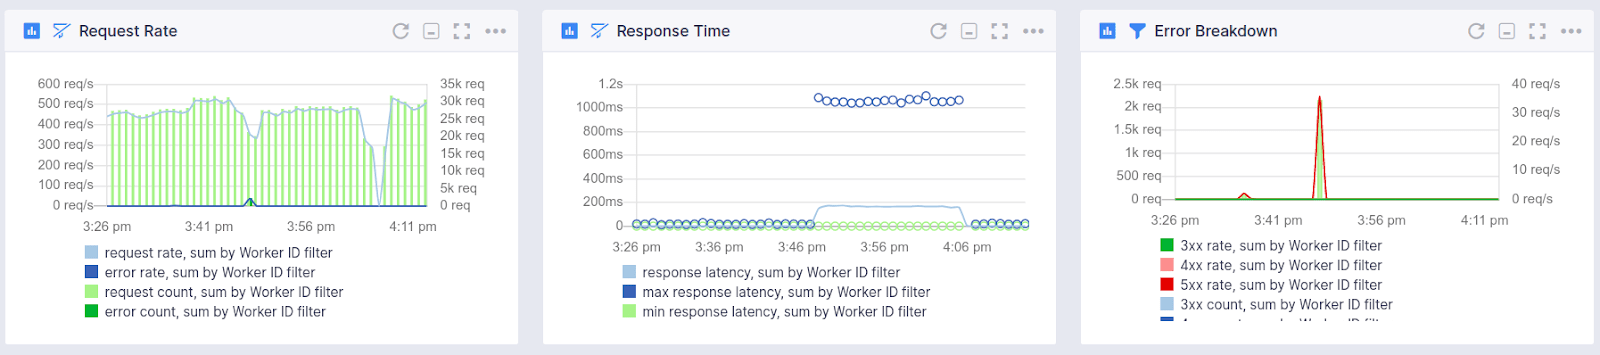
HTTP Server Stats
- Request count
- Request rate
- Response time
- Request/Response content-length
- Error rates (total, 3xx, 4xx, 5xx)
Use the cluster module to run Node.js
To make use of the full power of your server, you should run an instance of your Node.js application on each CPU core. The cluster module makes this easier than ever. Create another file called cluster.js.
// cluster.js

const cluster = require('cluster')
const numCPUs = require('os').cpus().length
const app = require('./app')
const port = process.env.PORT || 3000

const masterProcess = () => Array.from(Array(numCPUs)).map(cluster.fork)
const childProcess = () => app.listen(port)

if (cluster.isMaster) masterProcess()
else childProcess()
cluster.on('exit', (worker) => cluster.fork())
You load the agent in the same way you would when you run a basic Node.js server.
// app.js

// load env vars
require('dotenv').config({ path: '/absolute/path/to/your/project/.env' })
// start agent
require('spm-agent-nodejs')
...
Now you can run your app with:
The cluster will spin up a master process with a dedicated process ID and run numCPUs number of worker processes. They will be load balanced in a round-robin fashion from the master process.
This is not all, you should also make sure to run your Node.js application with Systemd to make it a system service and run automatically on startup and restart itself if it fails.
Set up Node.js with Systemd
The service files for the things that systemd controls all live under the directory path
Create a new file there:
And add this piece of code:
# /lib/systemd/system/app.service

[Unit]
Description=app.js - running your Node.js app as a system service
Documentation=https://yourwebsite.com
After=network.target

[Service]
Type=simple
User=root
ExecStart=/usr/bin/node /absolute/path/to/your/project/app.js
Restart=on-failure

[Install]
WantedBy=multi-user.target
To use Systemd to control the app you first need to reload the Daemon to register the new file.
Now launch your app with:
You've successfully launched your Node.js app using Systemd! If it doesn't work for some reason, make sure to check your paths in ExecStart are correct.
node binary and the absolute path to your app.js file.
Use PM2 to run Node.js
You can also run your application with PM2 just like you would normally. Using the same setup as with a default Node.js server. Load the env vars and agent at the top of your source file.
// app.js

require('dotenv').config({ path: '/absolute/path/to/your/project/.env' })
// start agent
require('spm-agent-nodejs')
...
Run the pm2 command to start your server.
The agent will detect you are running PM2 and start collecting metrics automatically.
Use Containers to run Node.js
You can also run your application in any container environment, like Docker, Docker Compose, Docker Swarm, or Kubernetes. You'll use the same setup as with a default Node.js server. But, instead of using dotenv, you'll add the environment variables when starting the container.
First of all, require the agent at the top of your init file:
Then, use this Dockerfile to make sure garbage collection metrics are enabled:
FROM alpine AS build
WORKDIR /usr/src/app
RUN apk add --no-cache --update \
  python3 \
  make \
  gcc \
  g++ \
  nodejs \
  nodejs-npm

COPY package.json package-lock.json ./
RUN npm install --production

#############

FROM alpine
WORKDIR /usr/src/app
RUN apk add --no-cache --update nodejs
COPY --from=build /usr/src/app/node_modules ./node_modules
COPY . .
EXPOSE <PORT>
CMD ["node", "app.js"]
Change the <PORT> you're exposing and if needed, change app.js to the entry point of your application.
Now build a Docker image from the Dockerfile above. Run this command in the same directory where you have the Dockerfile:
Docker
Next, run the Docker image. Add your MONITORING_TOKEN. Change the <PORT> to the one you're exposing and <YOUR_IMAGE:TAG> to the name of the image you just built. Optionally, add additional flags if you need to.
docker run -d -p <PORT>:<PORT> \
  -v /var/run/docker.sock:/var/run/docker.sock \
  -e MONITORING_TOKEN=<MONITORING_TOKEN> \
  <YOUR_IMAGE:TAG>
Docker Compose
Alternatively, you can use Docker Compose. Use this docker-compose.yml file alongside the Dockerfile above to build and run your application. First add your <MONITORING_TOKEN>, then change the <PORT> to the one you're exposing and <YOUR_IMAGE:TAG> to the name of the image you just built.
version: '3'
services:
  your-nodejs-app:
    build:
      context: ./
      dockerfile: Dockerfile
    image: '<YOUR_IMAGE:TAG>'
    environment:
      - MONITORING_TOKEN=<MONITORING_TOKEN>
    restart: always
    volumes:
      - '/var/run/docker.sock:/var/run/docker.sock'
    ports:
      - '<PORT>:<PORT>'
Docker Swarm
The same approach works for Docker Swarm. First add your <MONITORING_TOKEN>, then change the <PORT> to the one you're exposing and <YOUR_IMAGE:TAG> to the name of the image you just built.
docker service create --name your-nodejs-app \
  -p <PORT>:<PORT> \
  --restart-condition any \
  --mount type=bind,src=/var/run/docker.sock,dst=/var/run/docker.sock \
  -e MONITORING_TOKEN=<MONITORING_TOKEN> \
  <YOUR_IMAGE:TAG>
Alternatively, if you want to use a Docker Compose file with the docker stack command, add the snippet below to your docker-compose.yml file. First add your <MONITORING_TOKEN>, then change the <PORT> to the one you're exposing and <YOUR_IMAGE:TAG> to the name of the image you just built.
services:
  your-nodejs-app:
    image: '<YOUR_IMAGE:TAG>'
    environment:
      - MONITORING_TOKEN=<MONITORING_TOKEN>
    volumes:
      - '/var/run/docker.sock:/var/run/docker.sock'
    deploy:
      mode: replicated
      replicas: 1
      labels: [APP=APP]
      update_config:
        parallelism: 1
        delay: 5s
      restart_policy:
        condition: on-failure
        delay: 5s
    ports:
      - "<PORT>:<PORT>"
Kubernetes
To enable the agent in Kubernetes envs you first need to create a Cluster Role, Cluster Role Binding, and Service Account for the Agent to get permissions to access the Kubernetes API.
# Cluster Role bindings for Agent
apiVersion: rbac.authorization.k8s.io/v1
kind: ClusterRoleBinding
metadata:
  name: spm-agent-nodejs
  labels:
    app: spm-agent-nodejs
roleRef:
  apiGroup: rbac.authorization.k8s.io
  kind: ClusterRole
  name: spm-agent-nodejs
subjects:
- kind: ServiceAccount
  name: spm-agent-nodejs
  namespace: default
---
# Cluster Role for Agent
apiVersion: rbac.authorization.k8s.io/v1
kind: ClusterRole
metadata:
  name: spm-agent-nodejs
  labels:
    app: spm-agent-nodejs
rules:
- apiGroups:
  - ""
  resources:
  - pods
  verbs:
  - list
  - get
  - watch
---
# Service Account for Agent
apiVersion: v1
kind: ServiceAccount
metadata:
  name: spm-agent-nodejs
  labels:
    app: spm-agent-nodejs
Apply the cluster role.
Next, run the Docker image in your Kubernetes Cluster as a Deployment. Add your <MONITORING_TOKEN> Change the <PORT> to the one you're exposing, and <YOUR_IMAGE:TAG> to the name of the image you just built. You can edit the replicas as you see fit. Make sure to add serviceAccountName: spm-agent-nodejs to enable the required permissions.
apiVersion: apps/v1
kind: Deployment
metadata:
  name: your-nodejs-app-deployment
  labels:
    app: nodejs
spec:
  replicas: 3
  selector:
    matchLabels:
      app: nodejs
  template:
    metadata:
      labels:
        app: nodejs
    spec:
      serviceAccountName: spm-agent-nodejs
      containers:
      - name: nodejs
        image: <YOUR_IMAGE:TAG>
        ports:
        - containerPort: <PORT>
        env:
        - name: POD_NAME
          valueFrom:
            fieldRef:
              fieldPath: metadata.name
        - name: POD_NAMESPACE
          valueFrom:
            fieldRef:
              fieldPath: metadata.namespace
        - name: MONITORING_TOKEN
          value: "<MONITORING_TOKEN>"
Create the deployment.
Next, expose your Deployment with a Service. Change the <PORT> to the one you're exposing, and set the clusterIP if needed.
apiVersion: v1
kind: Service
metadata:
  name: your-nodejs-app-service
spec:
  selector:
    app: nodejs
  ports:
    - protocol: TCP
      port: 80
      targetPort: <PORT>
  type: LoadBalancer
  # if you are using a cloud provider (AWS, GCP, etc...)
  # a LoadBalancer will be provisioned automatically.
  # Otherwise set the clusterIP below.
  # clusterIP: <YOUR_CLUSTER_IP>
Create the service.
Troubleshooting
** Generate diagnostics file for Sematext Support **
If you are not seeing some or any Node.js metrics, you can create a "diagnostics dump" and contact us via chat or email. To create the diagnostics dump just run the following in your application directory:
This will create a ZIP file and show the Sematext Support email address to which the ZIP file should be sent.
Integration
- Agent: https://github.com/sematext/spm-agent-nodejs
- Tutorial: https://sematext.com/blog/nodejs-monitoring-made-easy-with-sematext/
- Instructions: https://apps.sematext.com/ui/howto/Node.js/overview
Metrics
| Metric Name | Key | Agg | Type | Description |
|---|---|---|---|---|
| heap total | nodejs.heap.size | Avg | Long | |
| heap used | nodejs.heap.used | Avg | Long | |
| total released | nodejs.gc.heap.diff | Sum | Double | |
| total duration | nodejs.gc.time | Sum | Double | |
| full gc | nodejs.gc.full | Sum | Long | |
| inc gc | nodejs.gc.inc | Sum | Long | |
| memory rss | nodejs.memory.rss | Avg | Long | |
| process count | process.count | All | Long | |
| process cpu usage | process.cpu.usage | All | Double | |
| process rss usage | process.rss | All | Double | |
| process thread count | process.thread.count | All | Long | |
| process uptime | process.uptime | All | Long | |
| workers count | nodejs.workers | Avg | Long | |
| request count | nodejs.requests | Sum | Long | |
| error count | nodejs.errors | Sum | Long | |
| 5xx count | nodejs.errors.5xx | Sum | Long | |
| 4xx count | nodejs.errors.4xx | Sum | Long | |
| 3xx count | nodejs.errors.3xx | Sum | Long | |
| total req. size | nodejs.requests.size.total | Sum | Long | |
| total res. size | nodejs.response.size.total | Sum | Long | |
| min response latency | nodejs.responses.latency.min | Min | Long | |
| max response latency | nodejs.responses.latency.max | Max | Long | |
| min latency | nodejs.eventloop.latency.min | Min | Long | |
| max latency | nodejs.eventloop.latency.max | Max | Long |
FAQ
How to Monitor OS and Infra metrics with the Node.js Integration?
We have deprecated the built-in Operating System monitor in the
Node.js-based Agent and
moved to using our Go-based Sematext Agent for
Operating System and Infrastructure metrics. If you are using the
spm-agent-nodejs >=4.0.0 or
the sematext-agent-express >=2.0.0
you are required to install or upgrade the Sematext Agent
to gather Operating System and Infrastructure metrics.
Can I install Node.js agent on Windows?
Yes. The native modules are automatically compiled during "npm install" (using node-gyp). On Windows the required build tools like python or C++ compilers are typically not installed by default. See https://github.com/TooTallNate/node-gyp for details about the required compiler and build tools.
How can I configure the Node.js agent for my app using PM2 process manager?
Install spm-agent-nodejs as a global module.
Add it to you source file, app.js in this example:
// app.js

require('dotenv').config({ path: '/absolute/path/to/your/project/.env' })
// start agent
require('spm-agent-nodejs')
...
First generate the PM2 config file:
This command will create a file called ecosystem.config.js.
// ecosystem.config.js
module.exports = {
  apps : [{
    name: 'API',
    script: 'app.js',

    // Options reference: https://pm2.io/doc/en/runtime/reference/ecosystem-file/
    args: 'one two',
    instances: 1,
    autorestart: true,
    watch: false,
    max_memory_restart: '1G',
    env: {
      NODE_ENV: 'development'
    },
    env_production: {
      NODE_ENV: 'production'
    }
  }]
  // ...
};
Edit this file so it has an interpreter_args section, and Sematext Node.js Monitoring Agent env variables.
// ecosystem.config.js
module.exports = {
  apps : [{
    name: 'APP',
    script: 'app.js', // replace with your server file
    instances: 'max', // will run one process per CPU core
    autorestart: true,
    watch: false,
    exec_mode: 'cluster', // fork works as well
    env: {
      NODE_ENV: 'development',
      MONITORING_TOKEN: '<your-monitoring-token-goes-here>',
      INFRA_TOKEN: '<your-infra-token-goes-here>',
      spmagent_dbDir: './spmdb',
      spmagent_logger__dir: './spmlogs',
      spmagent_logger__silent: false,
      spmagent_logger__level: 'error'
    },
    env_production: {
      NODE_ENV: 'production',
      MONITORING_TOKEN: '<your-monitoring-token-goes-here>',
      INFRA_TOKEN: '<your-infra-token-goes-here>',
      spmagent_dbDir: './spmdb',
      spmagent_logger__dir: './spmlogs',
      spmagent_logger__silent: false,
      spmagent_logger__level: 'error'
    }
  }]
  // ...
};
Run PM2 with the config file:
How can I use Node.js agent behind Firewalls / Proxy servers?
By default data is transmitted via HTTPS. If no direct connection is possible, a proxy server can be used by setting the environment variable HTTPS_PROXY=https://your-proxy.
What should I do after upgrading to a new Node.js version?
If you switch the Node.js version the spm-agent-nodejs package will need to be installed again (due to the fact that included native modules may change from version to version). After the version change please run a fresh "npm install" if you added spm-agent-nodejs to the dependencies in your package.json or at the very least run "npm install spm-agent-nodejs".
How do I upgrade to the latest version of spm-agent-nodejs?
To use the latest version of spm-agent-nodejs we recommend you install/upgrade using:
To add the dependency to your package.json simply use: