FAQ
General
What should I do if I can't find the answer to my question in this FAQ?
Check the general FAQ for questions that are not strictly about Sematext Synthetics. If you can't find the answer to your question please email support@sematext.com or use our live chat in the bottom right corner of the page.
When should I use a Browser Monitor and when an HTTP Monitor?
Use a Browser monitor when you want to:
- Monitor the performance of your web pages (page load time, web vitals, resource performance, and many more metrics)
- Simulate and monitor user journey/click path/web transactions using a real browser
- Monitor SSL certificates of your website
Use an HTTP monitor when you want to:
- Monitor the uptime of your APIs, web URLs or any HTTP endpoint
- Monitor the performance of your APIs
- Monitor SSL certificates of your APIs or web URLs
Can I monitor the endpoints and web pages behind the firewall?
Yes. You can use private agents to monitor the endpoints and web pages behind the firewall.
If you do not want to run private agents yourself, you can also configure the firewall to allow the requests from Synthetics agents running in the cloud. Configure your firewall to allow HTTP requests with specific headers. All requests from HTTP Monitor will contain x-sematext-origin: synthetics in their headers. For Browser monitors, you can configure the script to include a custom header for all requests. Please refer to fetch-use-token for an example of how to modify the request body or headers.
Can I monitor API endpoints protected by OAuth authentication?
Yes. This can be done using an HTTP Monitor, please see authentication. For Browser monitors, refer to the examples.
Can I monitor API endpoints protected by Basic authentication?
Yes. This can be done using an HTTP Monitor, please see authentication. For Browser monitors, refer to the examples visible in the UI by clicking the Browse Examples button on the screen where User Journey scripts are edited.
Can I monitor API endpoints protected by NTLM authentication?
Yes. This can be done using an HTTP Monitor, please see authentication. For Browser monitors, refer to the examples visible in the UI by clicking the Browse Examples button on the screen where User Journey scripts are edited.
Can I stop Synthetics Alerts during scheduled maintenance?
Yes. You can temporarily disable the notifications from Edit Configuration -> Configure Alerts -> Notifications. Once the maintenance window is over, you can re-enable the notifications. You can also use the Scheduled Pauses API.

Can I configure a monitor to alert only after N successive failures?
Yes. You can update the below setting in Edit Configuration -> Configure Alerts -> Notifications to notify only when there are N consecutive failures from any location. The default value is 1.
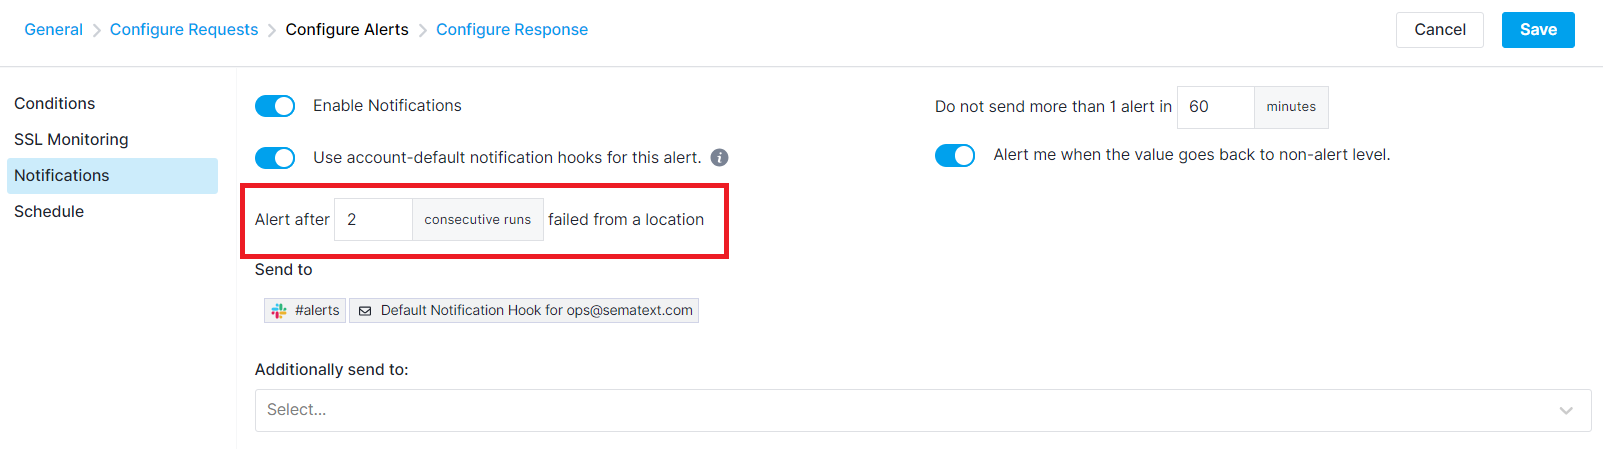
What is the difference between 'Consecutive Runs' and 'Alert after N Consecutive Failures' settings?
The Alert after N Consecutive Failures from a Specific Location setting is located in the Configure Alerts -> Notifications tab. Its purpose is to withhold alerts until the monitor has failed N times consecutively before triggering an alert.
On the other hand, the Consecutive Runs setting can be found in the General tab. It won't consider the monitor as failed after N retry attempts, and the retries will occur immediately after the run fails, instead of waiting for the usual interval. Because the retried runs are not treated as failed, these two settings will thus affect the monitor's availability statistics differently.
Multiple retries of the same failed run are not displayed in Sematext in order to avoid clutter and to maintain accurate SLA reporting. Only the final outcome of a run is displayed, regardless of whether it was retried once or multiple times.
See HTTP or Browser monitor configuration for more information on these settings.
What are the default timeouts for HTTP & Browser monitors?
The default timeouts for the monitors are covered in their respective documentation pages, in the run environment section:
Is there an API available?
Yes. Please see using the API.
Can I add monitors in bulk for monitoring multiple domains?
Yes, you can bulk add monitors for both HTTP and Browser Monitors using Apps Script. Follow the steps outlined in the Bulk Add Monitors via Apps Script guide.
How are redirects handled?
HTTP monitors don't follow redirects. If you think redirects should be followed please let us know.
Browser monitors follow redirects by default and collect metrics from the page to which the monitor has been redirected.
Currently, it is not possible to change the default settings, except for the default navigation timeout in the Browser monitor scripts. It can be changed using the page.setDefaultNavigationTimeout(timeout) API.
How can I filter requests from HTTP & Browser monitors?
Both HTTP and Browser monitor requests will have the string SematextSyntheticsRobot in the User-Agent header. If your analytics software doesn't already filter out requests from Synthetics, you can use the User-Agent header to filter requests from Synthetics.
Where can I find User Journey scripts that I can customize for my own needs?
You can find Browser monitor scripts for common use cases by selecting the Browse Examples button on the Configure URL/Script page while creating or editing a monitor. You can directly import a script from the example and change it to suit your needs. You can also find more examples here.
How can I securely store the credentials I supply to User Journey scripts?
By adding them as Sensitive Data, on which you can find more information here
Why is the latency reported by Browser monitors different from latency reported by HTTP monitors?
Short answer: Because they are measuring somewhat different things.
The HTTP monitor measures how long it takes to execute a single HTTP request and get a response. This includes performing a DNS lookup, establishing a TCP connection, sending of the request, and content transfer. On the other hand, the Browser monitor measures all of that, plus how long it takes to load and render the whole page, which includes fetching of external resources references in that page (e.g., CSS resources, JavaScript resources, etc.). If a User Journey script is used with a Browser monitor then that is included as well. Thus, it is expected that Browser monitors display higher latency.
What are the IP addresses from which monitors are run?
| Location | IP address |
|---|---|
| N. Virginia (us-east-1) | 52.202.60.97 |
| N. California (us-west-1) | 184.72.63.129 |
| Montreal (ca-central-1) | 15.157.18.14 |
| Mumbai (ap-south-1) | 15.207.239.77 |
| Singapore (ap-southeast-1) | 3.0.44.28 |
| Sydney (ap-southeast-2) | 54.153.196.213 |
| Frankfurt (eu-central-1) | 18.159.198.132 |
| Ireland (eu-west-1) | 54.77.99.140 |
| Sao Paulo (sa-east-1) | 54.207.1.35 |
Where can I see if a certain device is supported for Browser monitors?
You can simply type the name of your desired device into the Device type dropdown while creating a monitor and see if a matching option will be displayed. You can also find the list of devices we support, as well as their specific properties, in the Playwright code.
Can I extract a token from a request and use it for another request?
Yes. Create a Browser Monitor and select Monitor a User Journey in the Configure URL/Script step. Within the script you can send a POST request to your token provider API with Playwright's page.route() method. After grabbing the token from the response, you can intercept the next request and add your credentials to the request body with the following code.
  // Get the api request API to make our post call
  const apiRequest = page.request;

  // Make a POST request to the authentication endpoint
  const response = await apiRequest.post("$YOUR_URL_TO_AUTHENTICATE", {
      data: {
          username: "exampleUser",
          password: "examplePassword"
      }
  });
  // response.text() prints out the response body as a string, useful if you're not using JSON
  // response.json() parses the response body JSON and throws an error if it isn't valid JSON
  const responseJSON = await response.json();
 ```
Pass the extracted token to the next request in the request body
```javascript
 // Intercept the next request, change its method to POST and add the request header using the response we got from the first request
  const additionalHeaders = {
        "content-type": "application/json",
        "Authorization": `Bearer ${responseJSON.token}`
  };


  const secureURL = '$YOUR_SECURE_ENDPOINT';

  await page.route(secureURL, route => {
      route.continue({
          method: 'POST',
          headers: {
              ...route.request().headers(),
              ...additionalHeaders
          }
      });
  });

  console.log("Sending second request using info from the first response");
  const result = await page.goto(secureURL);
  console.log({
    url: result.url(),
    statusCode: result.status(),
    body: await result.text()
  });
Can I enforce same-origin policy for Browser monitors (CORS)?
Yes. We keep this setting disabled by default, but you can choose to enforce it in the Configure Options tab while creating or editing your Browser monitors. The reason why you would potentially want to enable this is that it being disabled could keep your Browser monitors from working properly if your website requires strict CSP+CORS to be enabled.
Why are some elements missing from my page during Browser monitor runs, even though they show up when I open it manually?
Please see the same-origin question right above this one, this issue could very well be fixed by toggling the option to enforce same-origin policy on. Also make sure to double check from which locations you're using the monitor, as your website may display different content for different locations.
How do I avoid intermittent issues from affecting the availability of my monitors?
The consecutive runs feature available in the General section for both HTTP and Browser monitors allows you to automatically run the monitor again after a failed run. Since the retried run will be run as soon as the failed run is reported, this can help avoid network errors or similar intermittent issues from affecting your overall availability, while still alerting you on issues which persist after multiple retries. Note that we reserve an extra 5% of the monitor's currently reserved runs per retry, with these extra runs being figured into the calculation at the bottom of the General page.
Do you have a script recorder for creating Playwright scripts?
We don’t have a built-in recorder, but you can still create Playwright scripts easily. We wrote a guide that shows how to do it step by step using Chrome and ChatGPT: How to Create Playwright Scripts for Website Monitoring with Chrome, ChatGPT
How do I do X in a User Journey script?
Please see the section on User Journey script examples.
How are Web Vitals calculated when a User Journey script visits multiple pages?
Web vitals are calculated only for the last page the User Journey script visits.
How do I bypass caching?
Caching can be bypassed by using the Cache-Control header directives: * no-cache: cache should be revalidated with the original resource before the response is sent back. * no-store: response from the request should not be stored.
The Cache-Control header can be assigned multiple values to obtain the desired functionality:
Note that the server must be configured to take the Cache-Control header into consideration, thus making the result dependent on the server that the request is sent to.The Cache-Control HTTP header was introduced in HTTP 1.1. Systems using HTTP 1.0 can instead make use of the Pragma header:
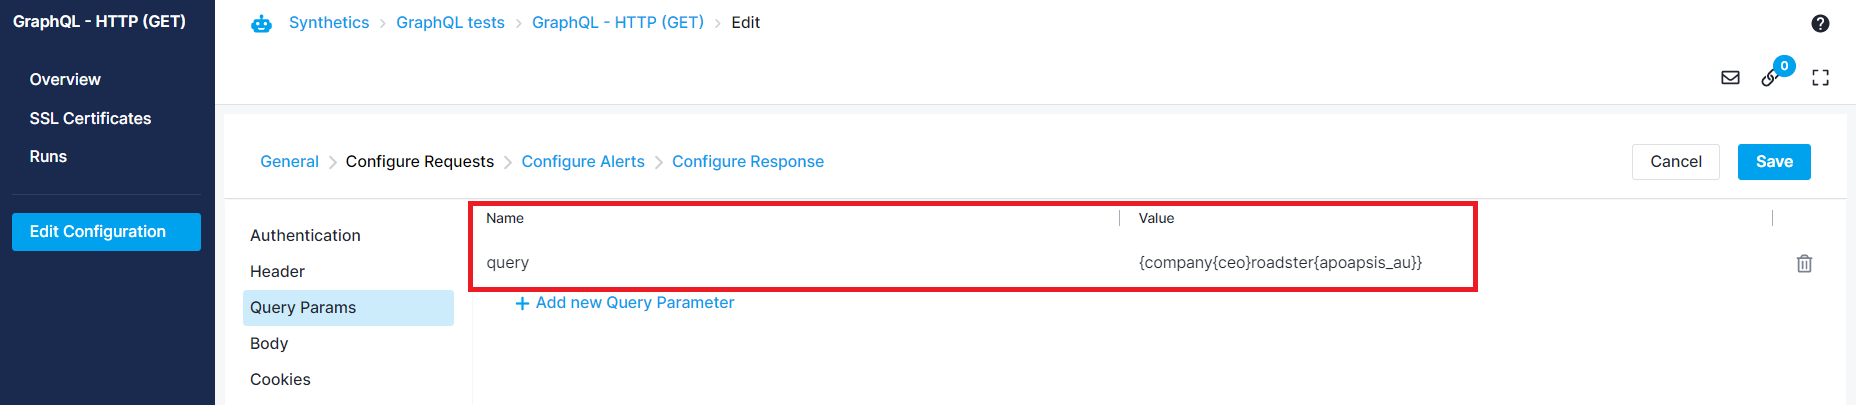
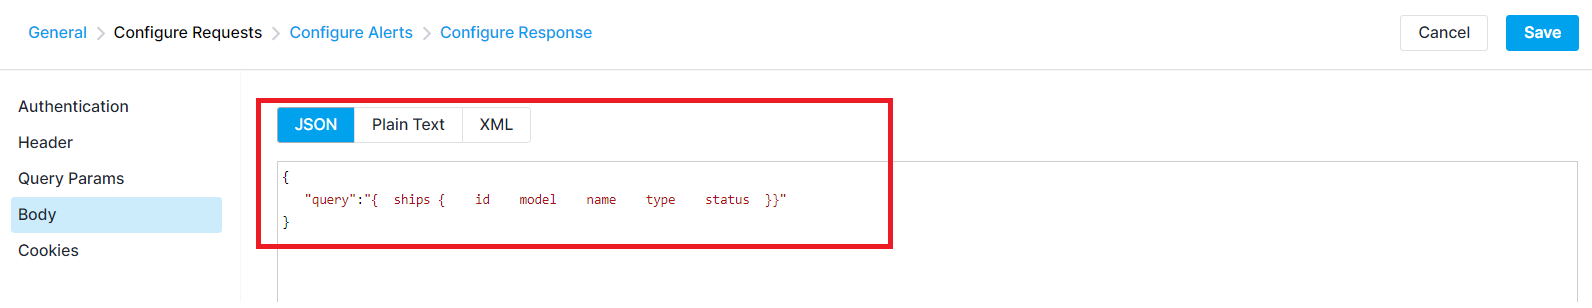
Can I call GraphQL endpoints?
Yes. You can call GraphQL endpoints with HTTP Monitors. In General tab pick the Method Type and enter the GraphQL endpoint. Set Content-Type to application/json from the Configure Requests --> Headers tab.
To send a GET request, set the query parameter from the Query Params tab.
To send a POST request, open the Body tab, set the content type to JSON and enter the query.
Why might I receive certificate errors even when the certificate is valid and not expired?
This issue typically arises due to differences in how HTTP and Browser Monitors verify SSL certificates.
- HTTP Monitors rely on the OS-level CA (Certificate Authority) bundle to validate SSL certificates. This means if the certificate chain of the monitored endpoint includes a root or intermediate certificate not trusted by the underlying OS, the monitor will fail with a certificate verification error.
- Browser Monitors, on the other hand, comes with its own internal CA bundle. This bundle is often more up-to-date and broader than what many OS environments have, which is why the Browser Monitor may succeed even when the HTTP Monitor fails.
Why does this happen?
Some institutions use internal or less commonly trusted certificate authorities for their web services. These are not part of the default OS CA bundle, leading to SSL verification failures in tools that rely on system trust stores (like our HTTP Monitors). In such cases, we recommend either disabling SSL certificate validation for the affected HTTP Monitors via the Configure Alerts → SSL Monitoring section, or switching to a Browser Monitor instead, which may succeed due to its built-in CA bundle.
Sharing
How can I share my Sematext Apps with other users?
See sharing FAQ.
What is the difference between OWNER, ADMIN, BILLING_ADMIN, and USER roles?
See info about user roles in sharing FAQ.
Alerts
Can I send alerts to PagerDuty, Slack, MS Teams, or other WebHooks?
See alerts FAQ.