RabbitMQ
RabbitMQ is an open-source message broker software that facilitates message queuing, enabling communication and transfer of data between distributed applications. The Sematext Agent collects RabbitMQ metrics and logs, transmits them to Sematext Cloud; installing the agent takes less than 5 minutes.
Install Sematext Agent
- Create an RabbitMQ Logs or Monitoring App. This will let you install the agent and control access to your monitoring and logs data.
- Install the Sematext Agent according to the https://apps.sematext.com/ui/howto/RabbitMQ/overview displayed in the UI.
- Install the RabbitMQ management plugin, if it's not already installed
- create a user with
administratortags, to be able to get all metrics - Configure Sematext Agent to connect to the RabbitMQ host and port (
localhost:15672by default), using your App token and the newly created user's credentials - After installing the agent and configuring RabbitMQ, discovered logs or metrics from RabbitMQ services detected on the host will start shipping automatically.
- If you've created an RabbitMQ Monitoring App and want to collect RabbitMQ logs as well, or vice versa, click on the Create Logs App button from the left menu panel. This will take you to the Create Logs App (or Monitoring App) page. When you select Use Existing Agent, all discovered log sources from RabbitMQ services are listed, allowing you to set up log and metric shipping easily without any additional installation. Having both RabbitMQ Logs and Monitoring Apps lets you correlate performance metrics and logs, and accelerate troubleshooting using Split Screen for faster resolution.For example, if you see a spike in connection metrics, you can check logs to see what are the sources of these connections. Or if you see an increase in authentication errors, monitoring can tell what's the impact on RabbitMQ's memory usage, garbage collection and CPU.
To explore logs and services across multiple hosts, navigate to Fleet & Discovery > Discovery > Services (or Sematext Cloud Europe). From there, you can create additional Apps or stream data to existing ones without requiring any additional installations.
Important RabbitMQ Metrics to Watch
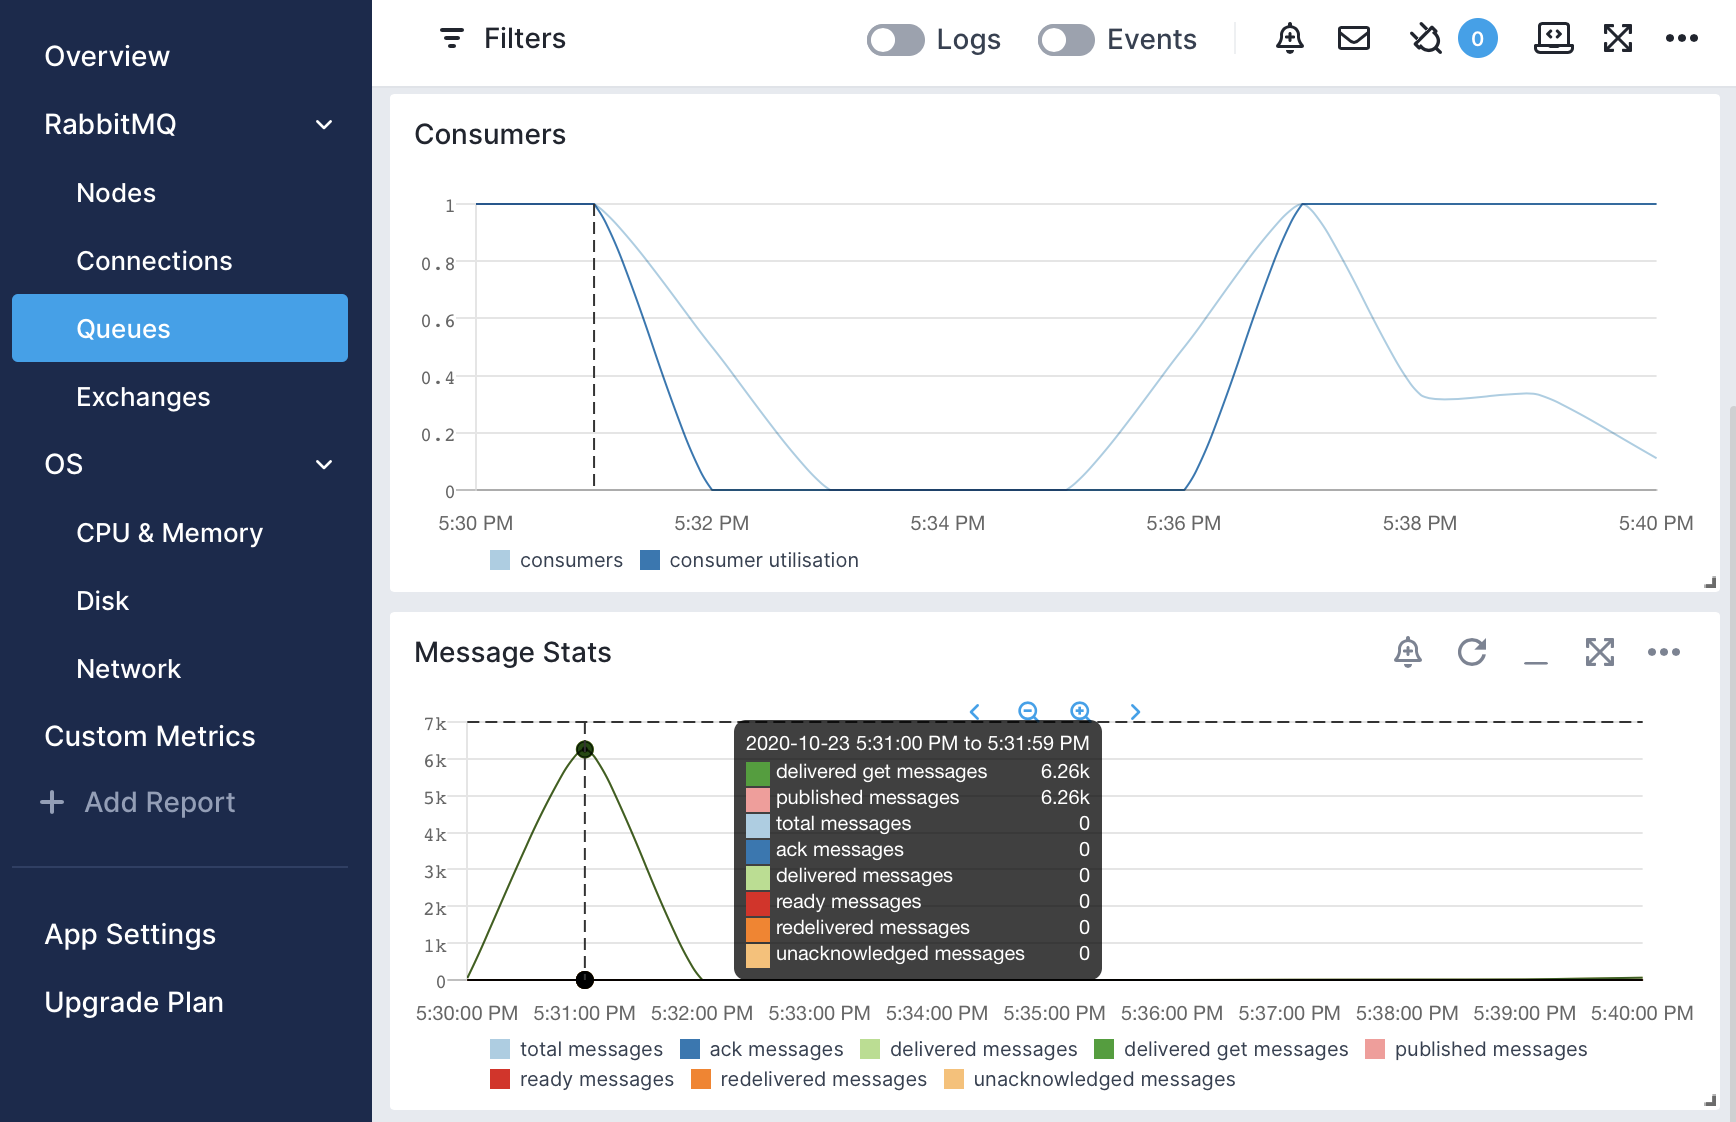
The usual entry point is the Messages report: do you have many messages published in a specific timeframe? Out of those, how many are unacknowledged or redelivered? These could be red flags.
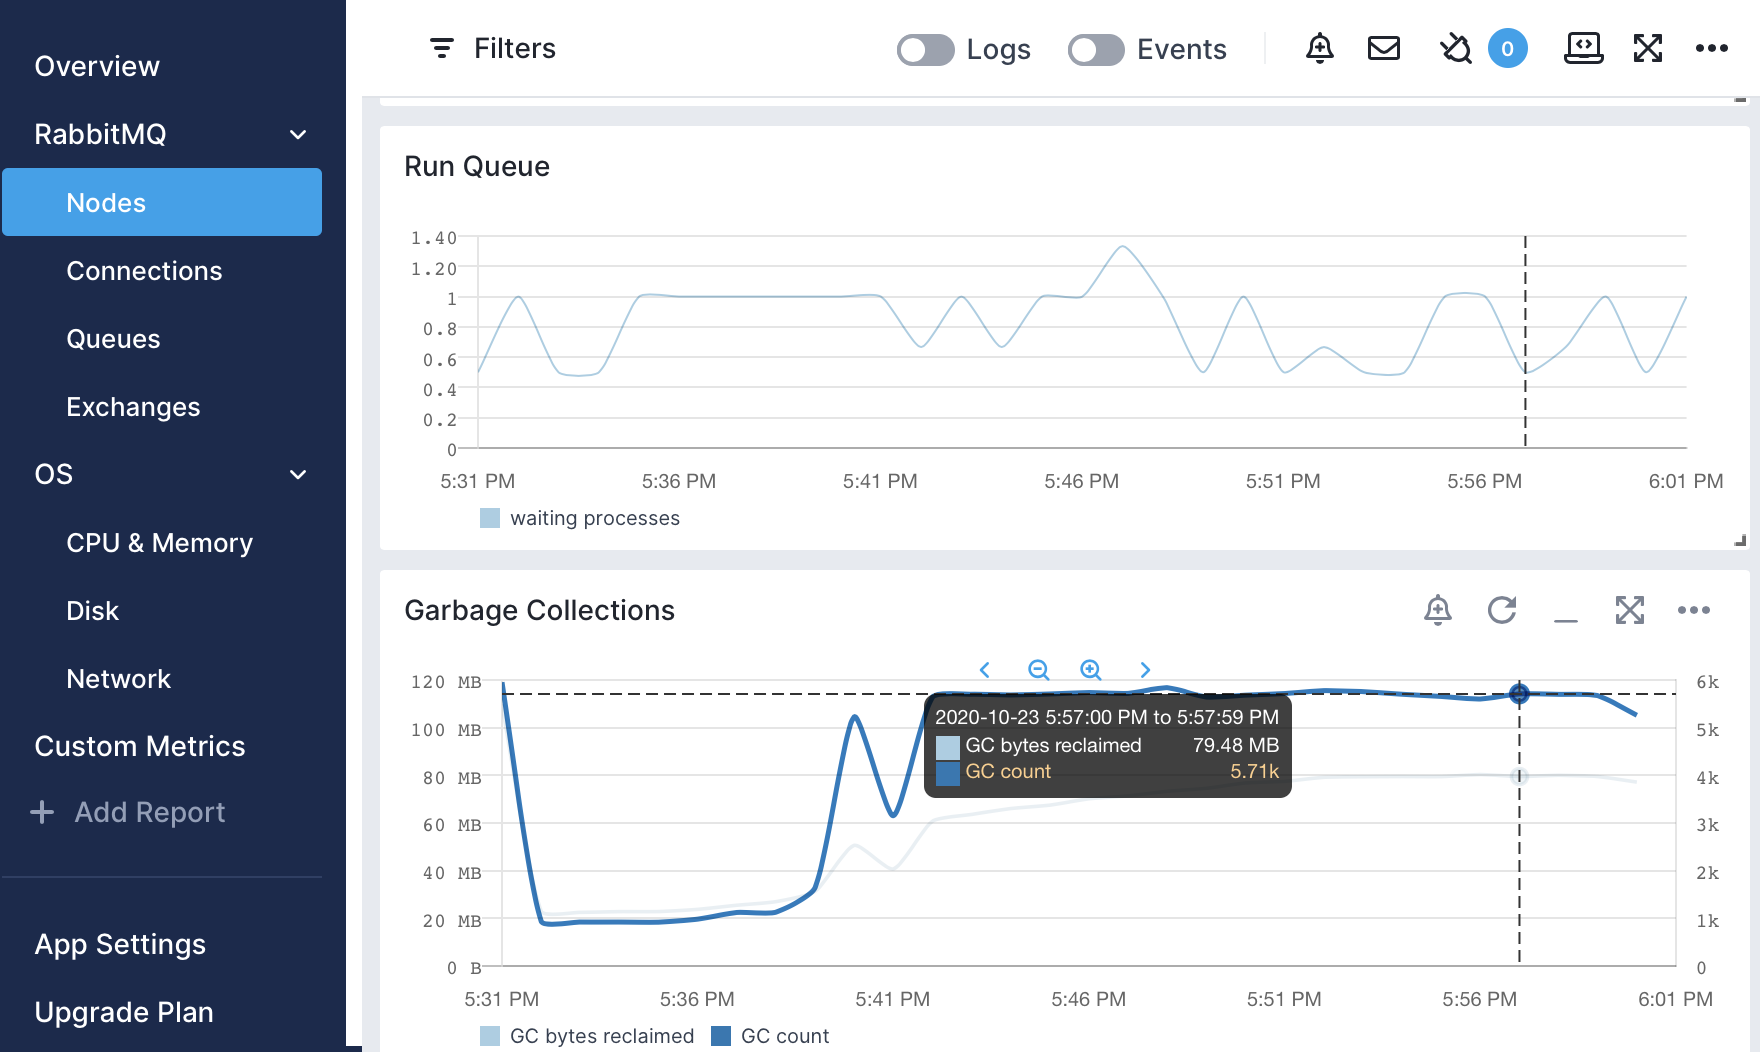
If there are any signs of trouble, it's time to dig deeper. Is the RabbitMQ server itself at fault? Check the Nodes metrics, such as Garbage Collection or Run Queue size:
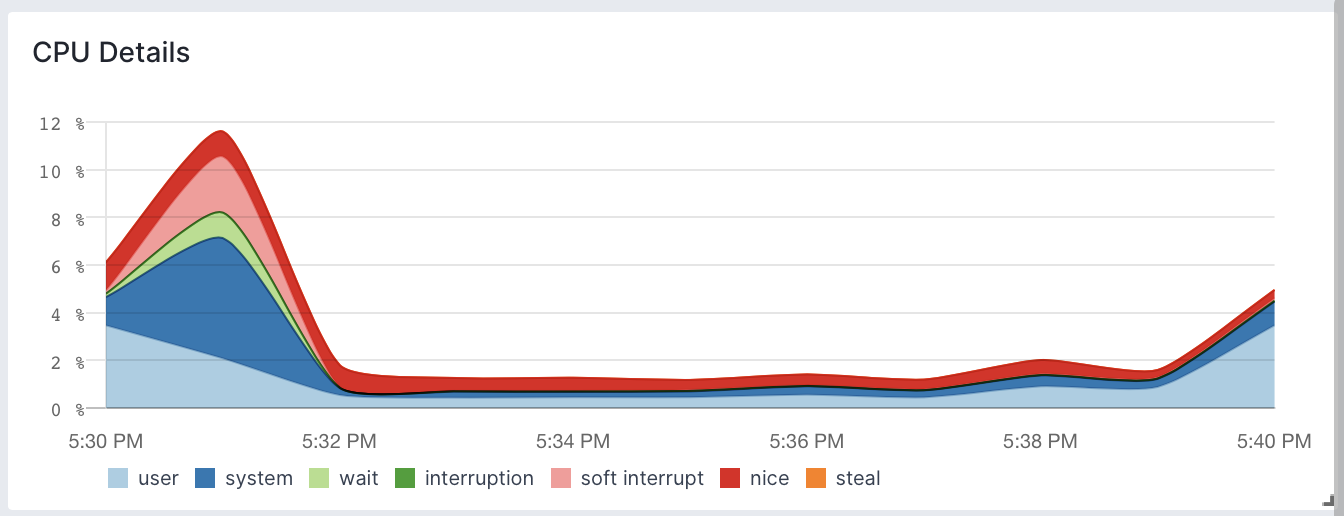
Finally, OS-level metrics can also point out bottlenecks, such as network or CPU:
Metrics
| Metric Name Key (Type) (Unit) |
Description |
|---|---|
| connections connections.count (gauge) |
Total number of connections |
| channels channels.count (gauge) |
Total number of channels |
| queues queues.count (gauge) |
Total number of queues |
| consumers consumers.count (gauge) |
Total number of consumers |
| messages messages.count (gauge) |
Total number of messages (ready plus unacknowledged) |
| ready messages messages.ready.count (gauge) |
Number of messages ready for delivery |
| unacknowledged messages messages.unacknowledged.count (gauge) |
Number of unacknowledged messages |
| ack messages messages.acked (counter) |
Number of messages delivered to clients and acknowledged |
| confirmed messages messages.confirmed (counter) |
Count of messages confirmed |
| delivered get messages messages.delivered.get (counter) |
Sum of messages delivered in acknowledgement mode to consumers, in no-acknowledgement mode to consumers, in acknowledgement mode in response to basic.get, and in no-acknowledgement mode in response to basic.get |
| published messages messages.published (counter) |
Count of messages published |
| published in messages messages.published.in (counter) |
Count of messages published from channels into this exchange |
| published out messages messages.published.out (counter) |
Count of messages published from this exchange into queues |
| unroutable messages messages.returned.unroutable (counter) |
Count of messages returned to publisher as unroutable |
| redelivered messages messages.redelivered (counter) |
Count of subset of messages in deliver_get which had the redelivered flag set |
| ack messages exchanges.messages.acked (counter) |
Number of messages delivered to clients and acknowledged (per exchange) |
| confirmed messages exchanges.messages.confirmed (counter) |
Count of messages confirmed (per exchange) |
| delivered get messages exchanges.messages.delivered.get (counter) |
Sum of messages delivered in acknowledgement mode to consumers, in no-acknowledgement mode to consumers, in acknowledgement mode in response to basic.get, and in no-acknowledgement mode in response to basic.get. Also per exchange |
| published messages exchanges.messages.published (counter) |
Count of messages published, per exchange |
| published in messages exchanges.messages.published.in (counter) |
Count of messages published from channels into this exchange |
| published out messages exchanges.messages.published.out (counter) |
Count of messages published from this exchange into queues |
| unroutable messages exchanges.messages.returned.unroutable (counter) |
Count of messages returned to publisher as unroutable (per exchange) |
| redelivered messages exchanges.messages.redelivered (counter) |
Count of subset of messages in deliver_get which had the redelivered flag set (per exchange) |
| GC count gc.count (counter) |
Number of garbage collections |
| GC bytes reclaimed gc.reclaimed.bytes (counter) |
Bytes reclaimed by garbage collections |
| used files file.descriptors.used (gauge) |
Used file descriptors |
| free space disk.free (counter) |
Current free disk space |
| used memory memory.used (gauge) |
Memory used in bytes |
| waiting processes process.wait (gauge) |
Average number of Erlang processes waiting to run |
| used sockets sockets.used (gauge) |
Number of file descriptors used as sockets |
| partitions network.partitions (gauge) |
Number of network partitions this node is seeing |
| running node.running (gauge) |
Is the node running or not |
| memory alarm memory.alarm.enabled (gauge) |
Does the host have memory alarm |
| disk alarm disk.alarm.enabled (gauge) |
Does the node have disk alarm |
| active consumers queues.consumers.active (gauge) |
Number of active consumers, consumers that can immediately receive any messages sent to the queue |
| consumers queues.consumers (gauge) |
Number of consumers |
| consumer utilisation queues.consumer.utilisation (gauge) |
The ratio of time that a queue's consumers can take new messages |
| memory queues.memory (gauge) |
Bytes of memory consumed by the Erlang process associated with the queue, including stack, heap and internal structures |
| messages queues.messages (gauge) |
Count of the total messages in the queue |
| ready messages queues.messages.ready (gauge) |
Number of messages ready to be delivered to clients (per queue) |
| unacknowledged messages queues.messages.unacknowledged (gauge) |
Number of messages delivered to clients but not yet acknowledged (per queue) |
| ack messages queues.messages.acked (counter) |
Number of messages delivered to clients and acknowledged (per queue) |
| delivered messages queues.messages.delivered (counter) |
Count of messages delivered in acknowledgement mode to consumers (per queue) |
| delivered get messages queues.messages.delivered.get (counter) |
Sum of messages delivered in acknowledgement mode to consumers, in no-acknowledgement mode to consumers, in acknowledgement mode in response to basic.get, and in no-acknowledgement mode in response to basic.get. Per queue. |
| published messages queues.messages.published (counter) |
Count of messages published (per queue) |
| redelivered messages queues.messages.redelivered (counter) |
Count of subset of messages in deliver_get which had the redelivered flag set |
Logs
Once data is in, you can explore it via the built-in reports:
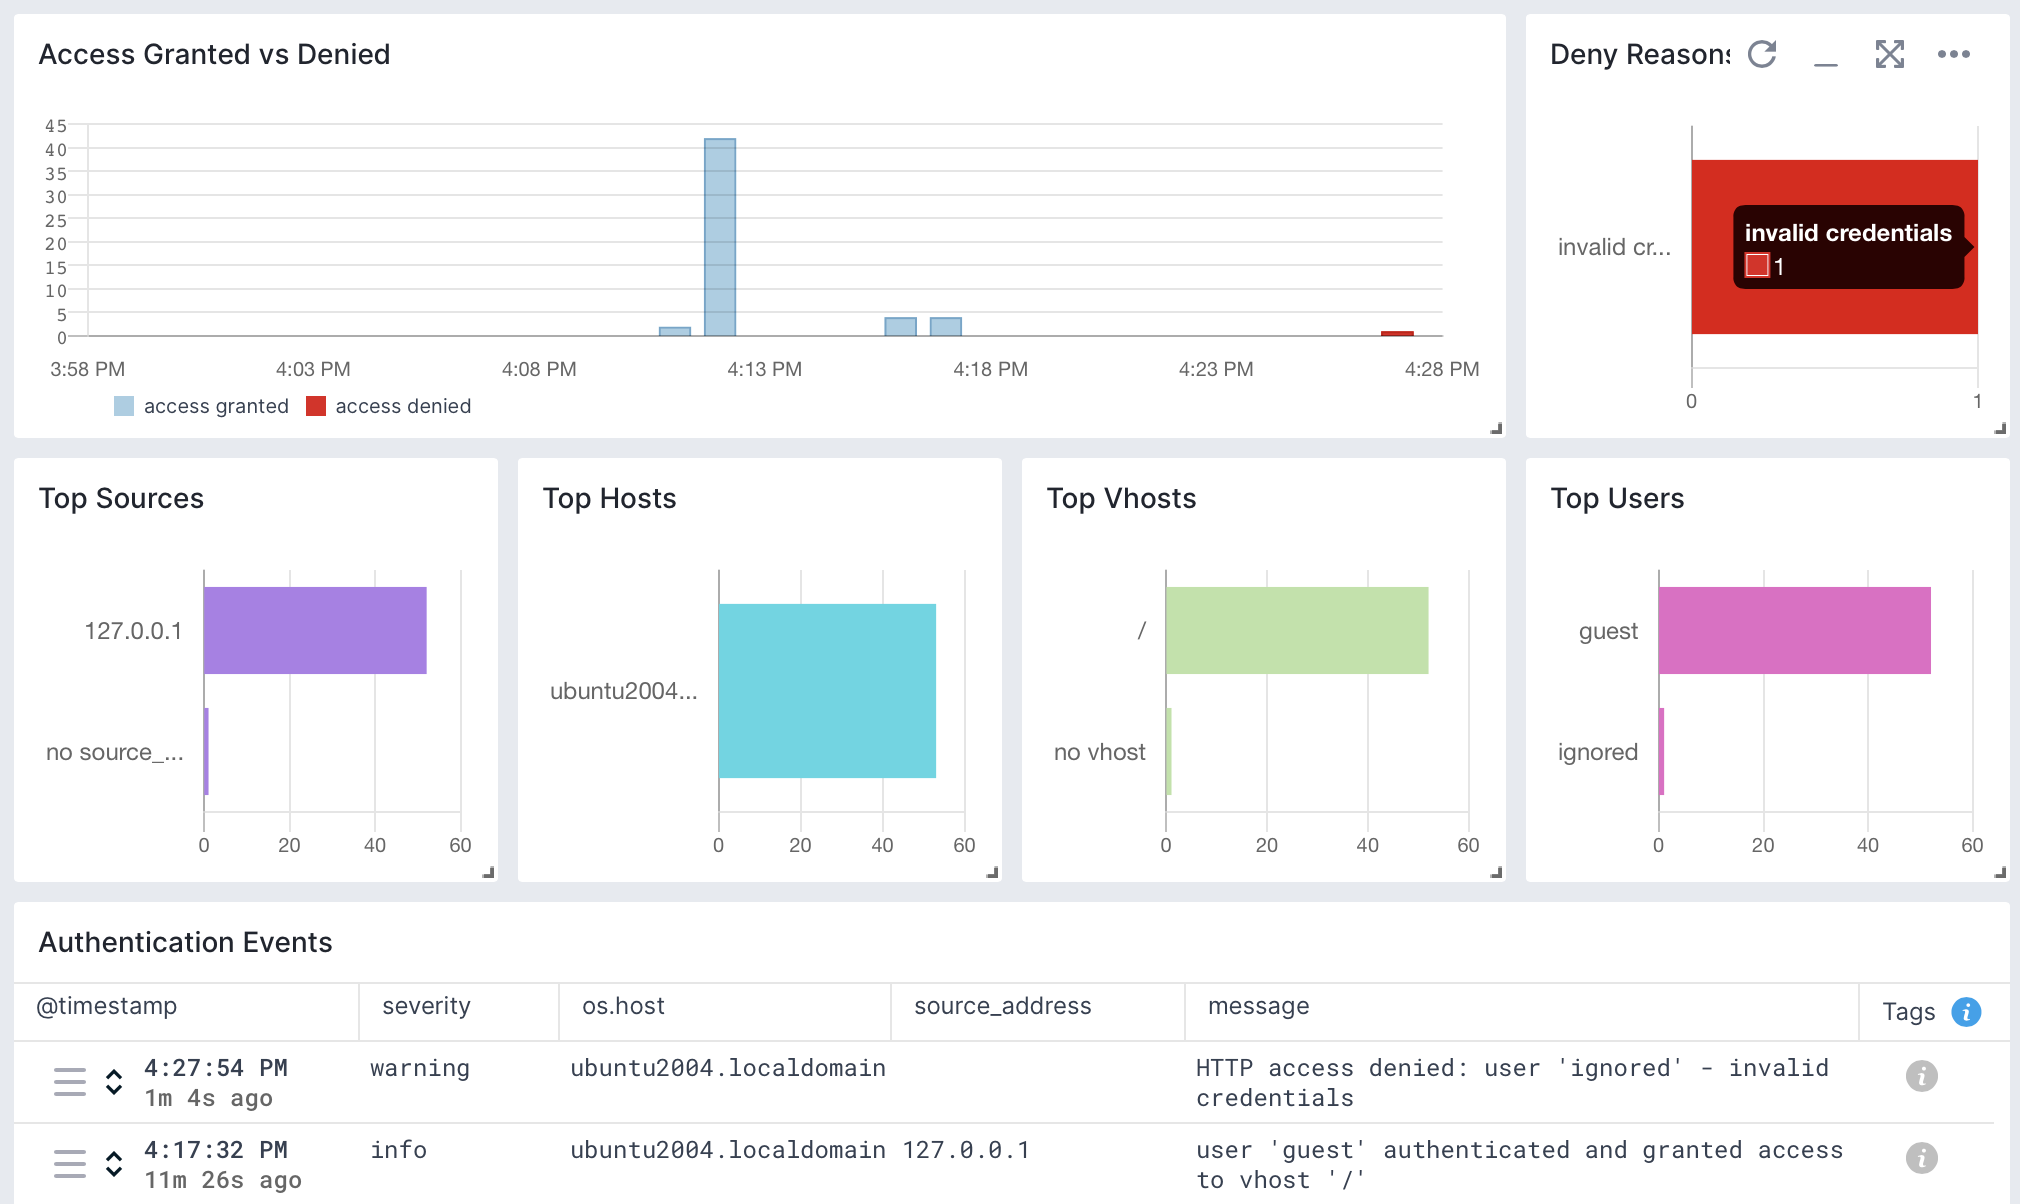
Exploring logs
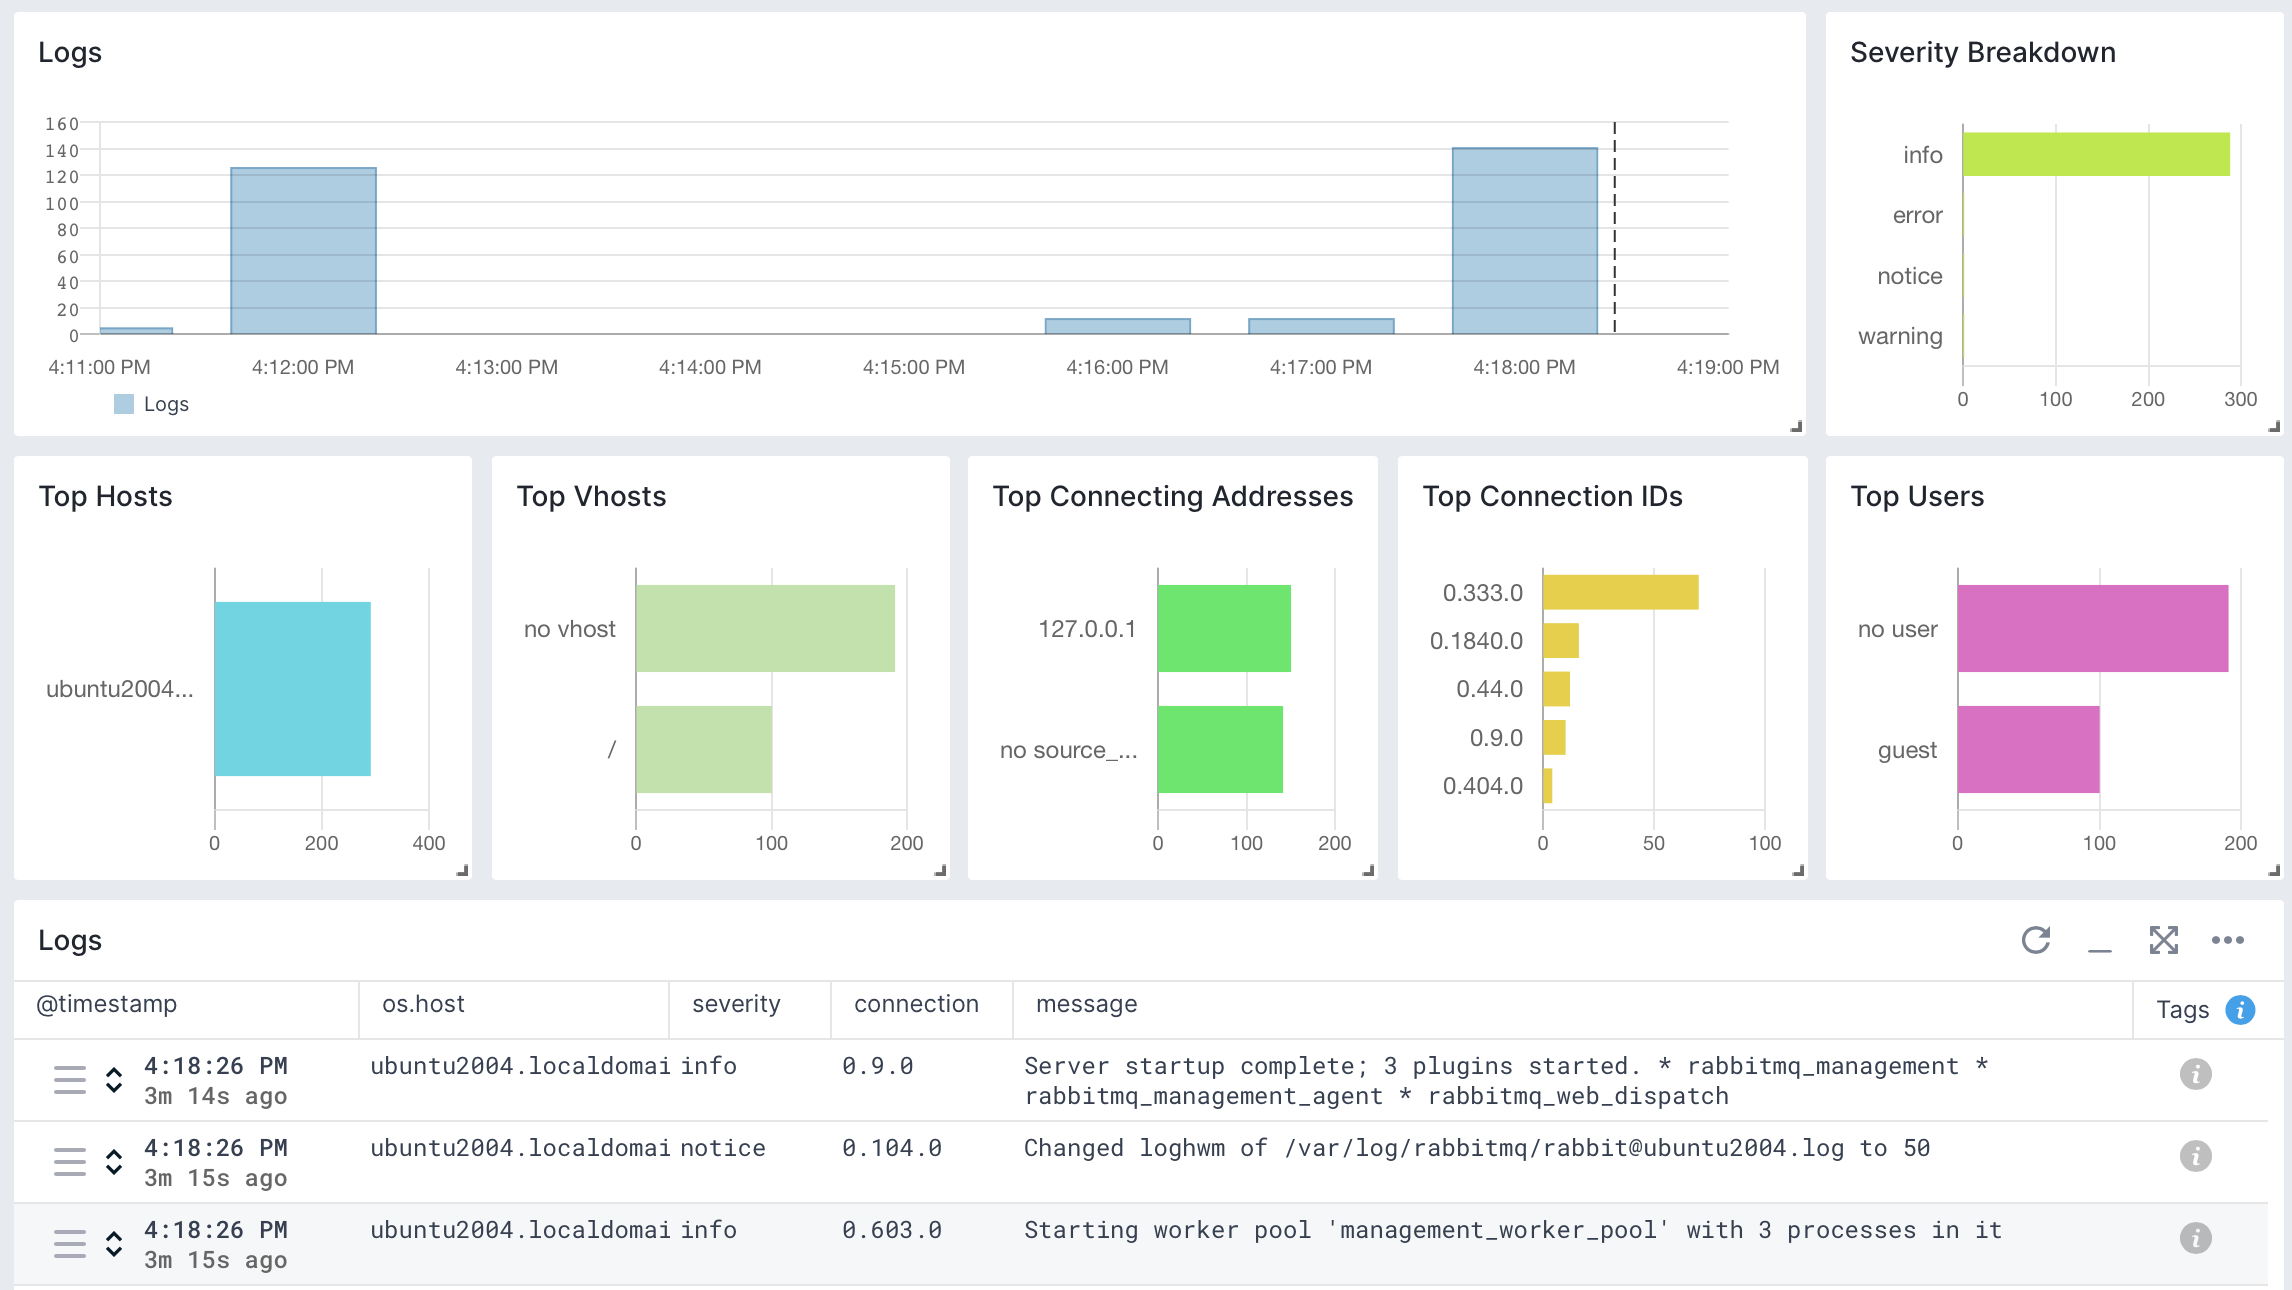
Once data is in, you can explore it using the built-in reports or create your own. For example, you can use the Authentication report to check on granted and denied connections:
Other built-in reports include:
- Connections: Logs specifically about accepted and closed connections. You can see here when you have spikes in connection creation. You can also identify noisy sources, users, as well as popular destinations.
- Start & Stop: Logs about RabbitMQ startup and shutdown. Besides unexpected restarts, you can find info about which write-ahead logs (WALs) were recovered.
Troubleshooting
If you are having trouble sending logs, try out the latest version of the Sematext Agent. Additionally, make sure to check out the Log Agents panel for any errors, and refer to our Sematext Logs FAQ for useful tips.