PostgreSQL
PostgreSQL is a powerful open-source relational database management system (RDBMS) known for its robustness, extensibility, and compliance with SQL standards. The Sematext Agent collects PostgreSQL metrics and logs, transmits them to Sematext Cloud; installing the agent takes less than 5 minutes.
Install Sematext Agent
- Create an PostgreSQL Logs or Monitoring App. This will let you install the agent and control access to your monitoring and logs data.
- Install the Sematext Agent according to the https://apps.sematext.com/ui/howto/PostgreSQL/overview displayed in the UI.
- After installing the agent, discovered logs or metrics from PostgreSQL services detected on the host will start shipping automatically.
- If you've created an PostgreSQL Monitoring App and want to collect PostgreSQL logs as well, or vice versa, click on the Create Logs App button from the left menu panel. This will take you to the Create Logs App (or Monitoring App) page. When you select Use Existing Agent, all discovered log sources from PostgreSQL services are listed, allowing you to set up log and metric shipping easily without any additional installation.
Having both PostgreSQL Logs and Monitoring Apps lets you correlate performance metrics and logs, and accelerate troubleshooting using Split Screen for faster resolution. For example, if you see a spike in number of rows fetched, you can check logs to see which queries fetch too many rows. A concrete example of doing that can be found in this article. Or if you notice expensive queries in the logs, monitoring can tell you whether they hit the indices or they were mostly scans.
To explore logs and services across multiple hosts, navigate to Fleet & Discovery > Discovery > Services (or Sematext Cloud Europe). From there, you can create additional Apps or stream data to existing ones without requiring any additional installations.
From number of rows and connections to index and function-specific metrics, all the relevant stats are collected and displayed in built-in dashboards:
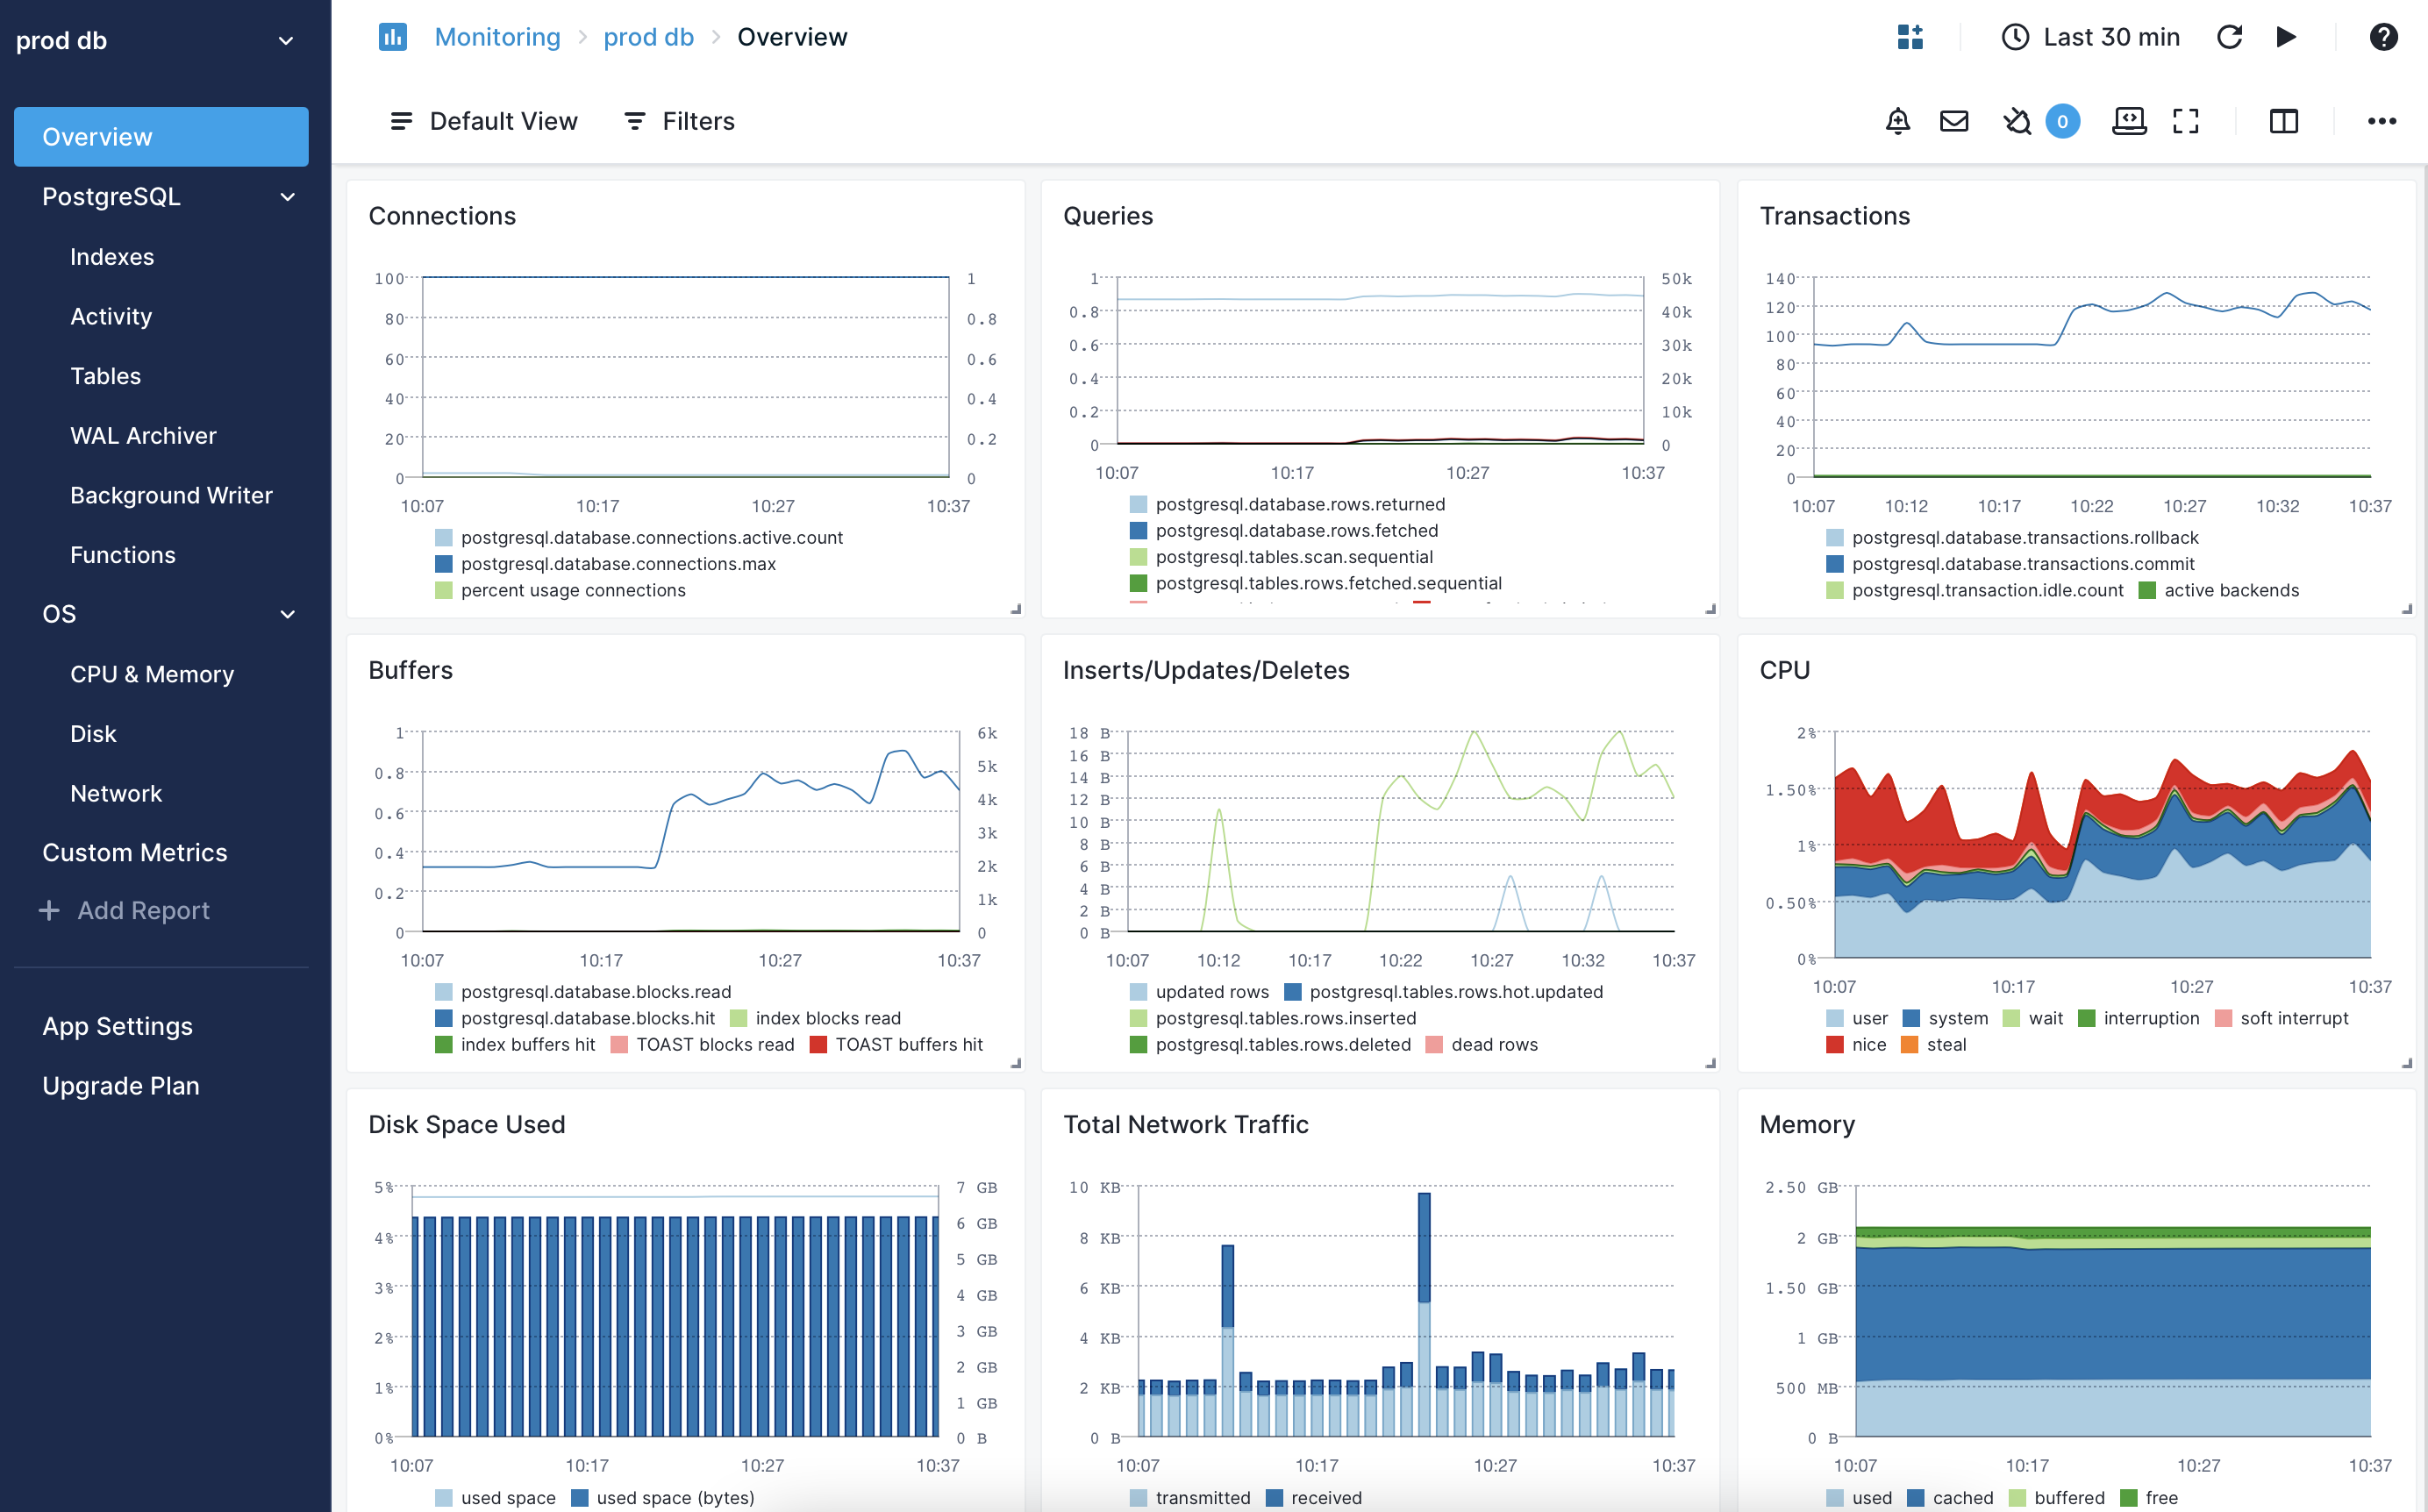
Important PostgreSQL Metrics to Watch
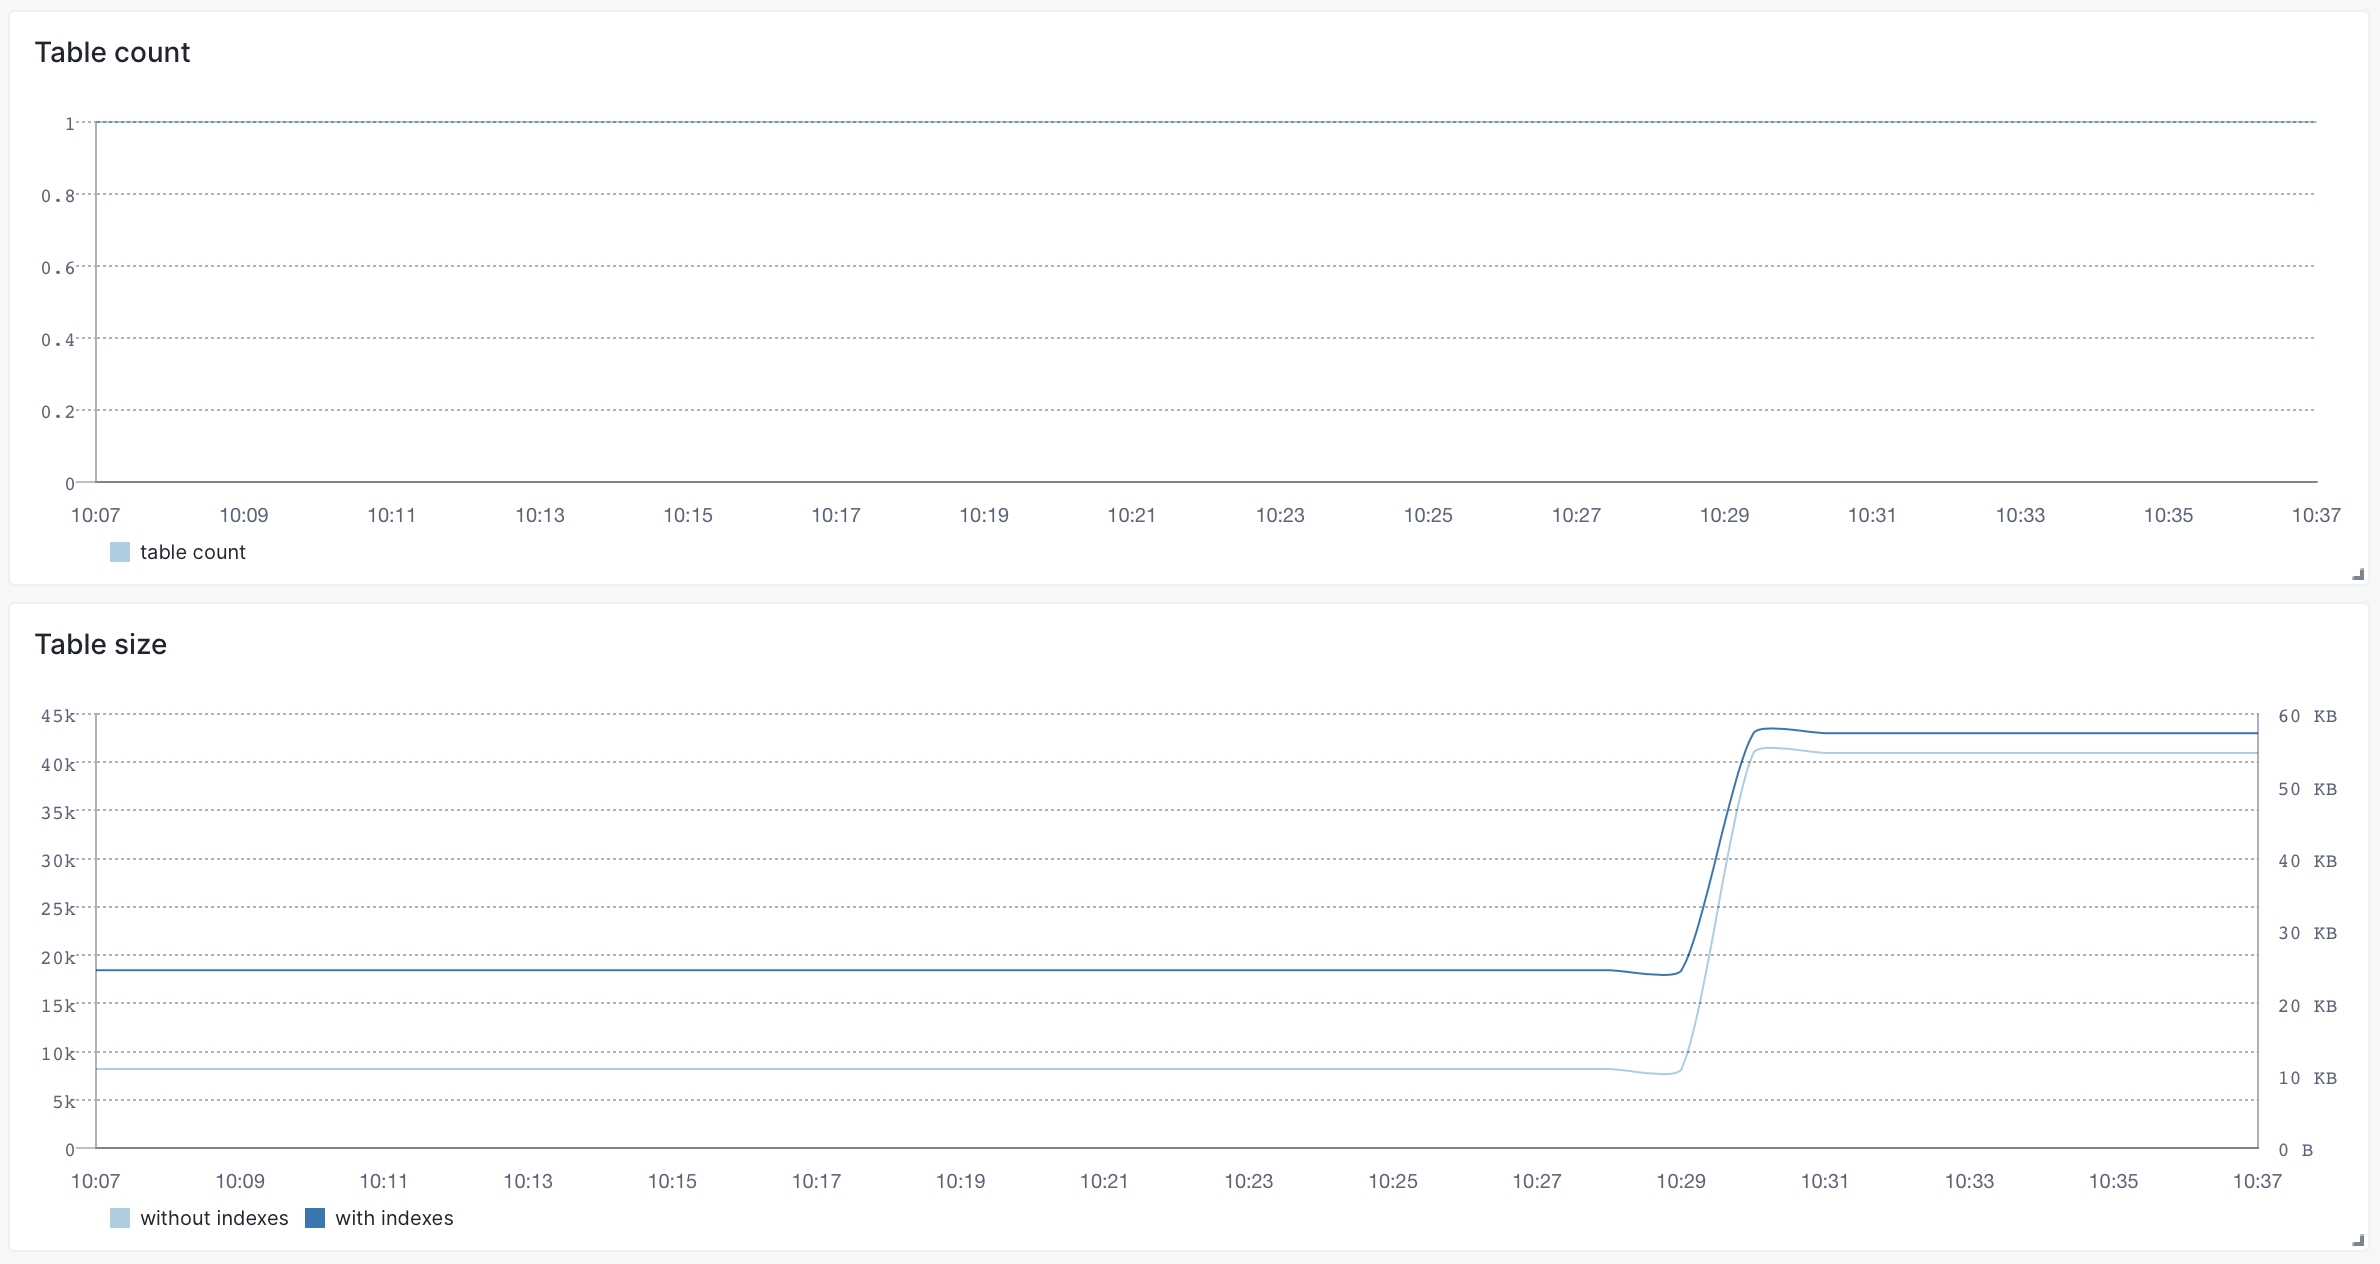
You'd normally start from the Overview screen to check the higher-level metrics, such as number of rows or connections over time. Other high-level metrics can be found under Activity or Tables dashboards:
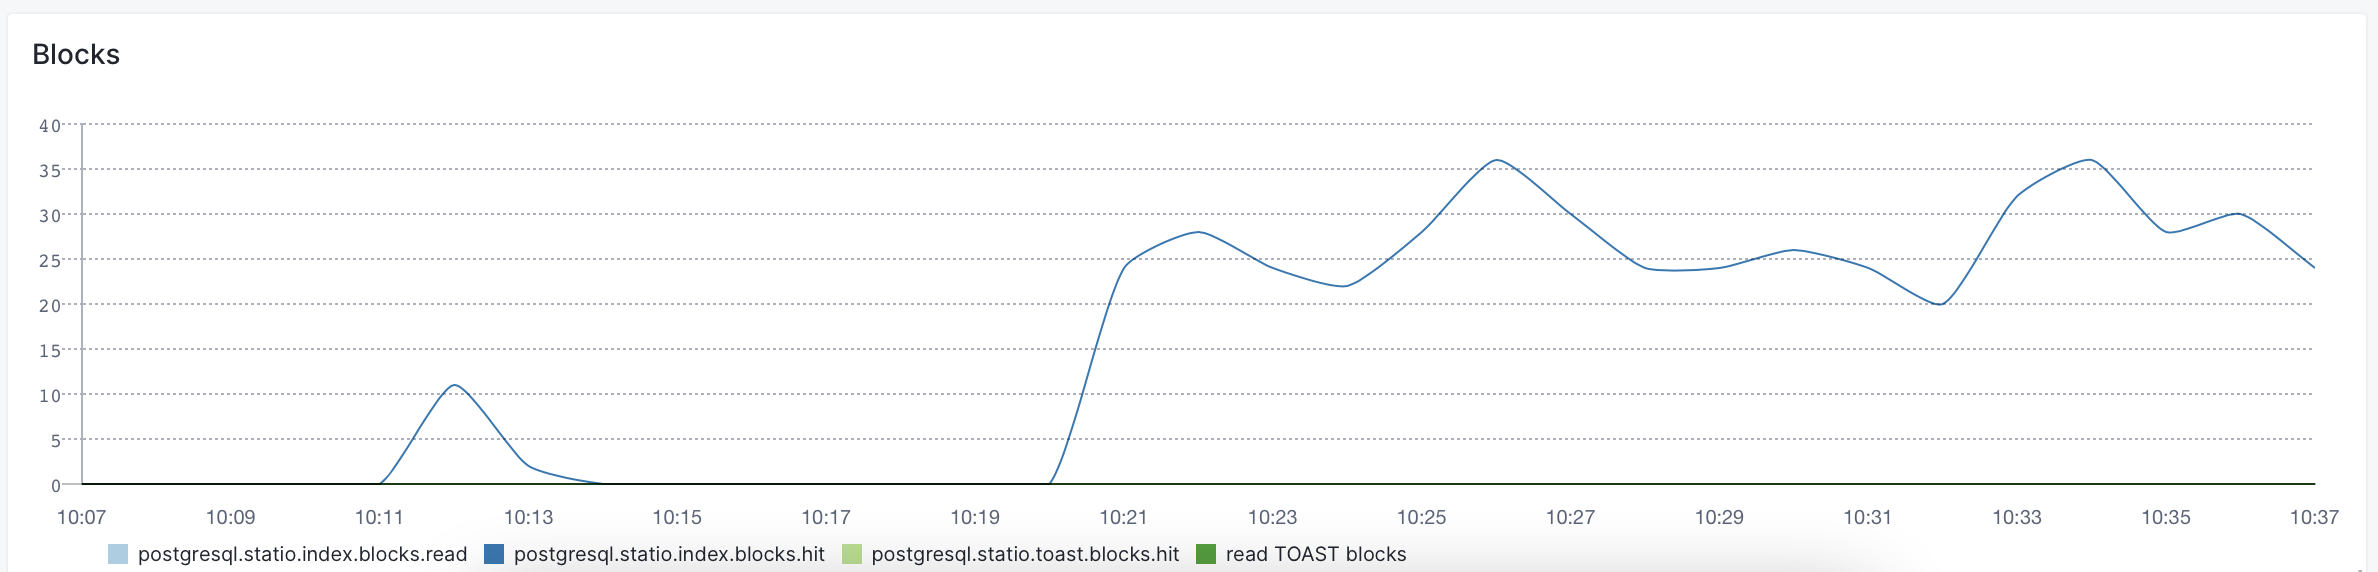
Then, if necessary, you can dive deeper into a specific direction. For example, if you think that indexes are over-used or not used enough, you can check their metrics in the Indexes dashboard. Like how often the index blocks are hit:
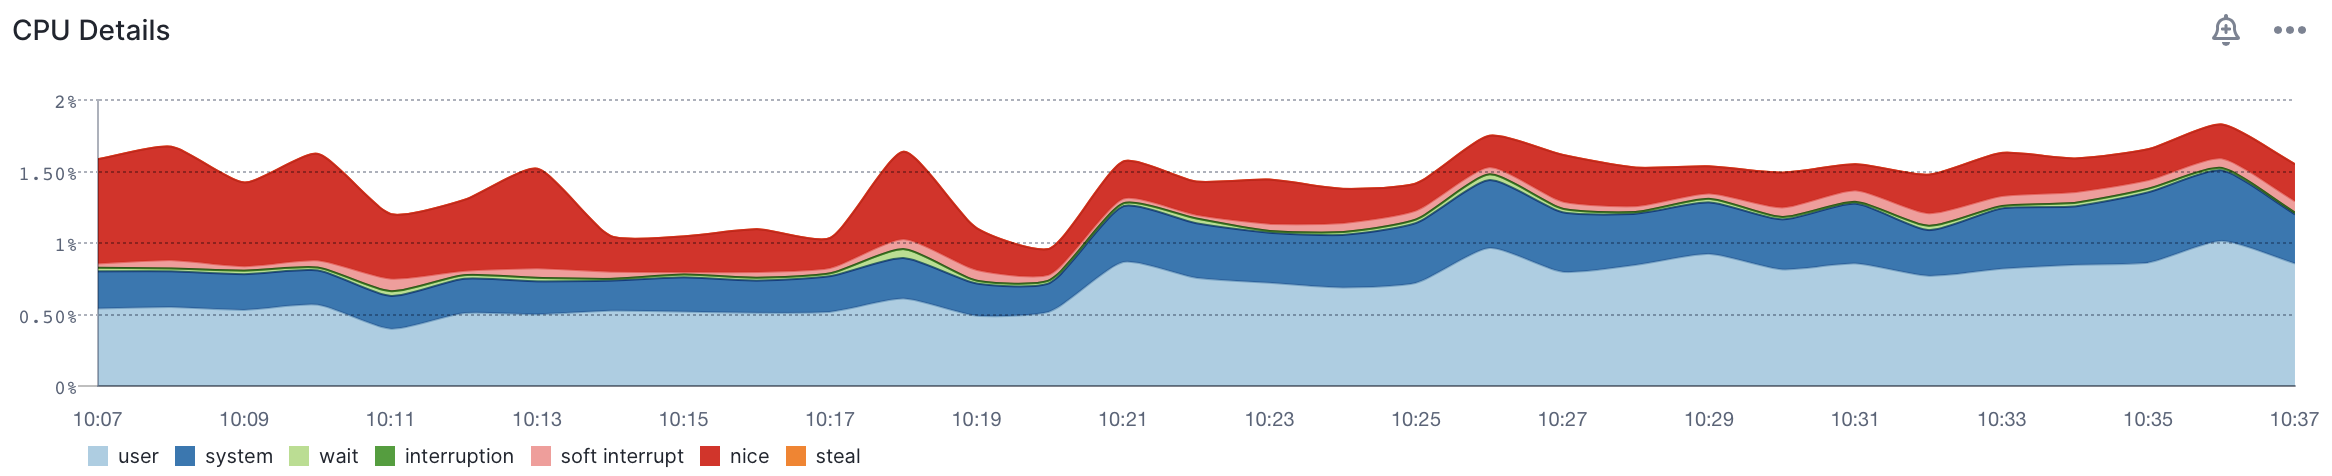
Finally, OS-level metrics can also point out bottlenecks, such as network or CPU:
You can find a full list of PostgreSQL-specific metrics that are collected below.
Metrics
| Metric Name Key (Type) (Unit) |
Description |
|---|---|
| active backends use transaction.open.count (long gauge) |
Number of backends executing a query |
| idle backends transaction.idle.count (long gauge) |
Number of backends in a transaction, but not currently executing a query |
| WAL files archiver.wal.success.count (counter) |
Number of WAL files that have been successfully archived |
| failed WAL files archiver.wal.failed.count (counter) |
Number of failed attempts to archive WAL files |
| scheduled checkpoints bgwriter.checkpoints.scheduled (counter) |
Number of scheduled checkpoints that have been performed |
| requested checkpoints bgwriter.checkpoints.requested (counter) |
Number of requested checkpoints that have been performed |
| checkpoint buffers bgwriter.buffers.written (counter) |
Number of buffers written during checkpoints |
| cleaned buffers bgwriter.buffers.clean (counter) |
Number of buffers written by the background writer |
| max written clean buffers bgwriter.buffers.cleaning.maxwritten.stopped (counter) |
Number of times the background writer stopped a cleaning scan because it had written too many buffers |
| backend buffers bgwriter.buffers.backend (counter) |
Number of buffers written directly by a backend |
| allocated buffers bgwriter.buffers.alloc (counter) |
Number of buffers allocated |
| active connections database.connections.active.count (long gauge) |
Number of backends currently connected to this database |
| committed transactions database.transactions.commit (counter) |
Number of transactions in this database that have been committed |
| rolled back transactions database.transactions.rollback (counter) |
Number of transactions in this database that have been rolled back |
| disk blocks read database.blocks.read (counter) |
Number of disk blocks read in this database |
| disk block cache hit database.blocks.hit (counter) |
Number of times disk blocks were found already in the buffer cache, so that a read was not necessary (this only includes hits in the PostgreSQL buffer cache, not the operating system's file system cache) |
| rows returned database.rows.returned (counter) |
Number of rows returned by queries in this database |
| rows fetched database.rows.fetched (counter) |
Number of rows fetched by queries in this database |
| rows inserted database.rows.inserted (counter) |
Number of rows inserted by queries in this database |
| rows updated database.rows.updated (counter) |
Number of rows updated by queries in this database |
| rows deleted database.rows.deleted (counter) |
Number of rows deleted by queries in this database |
| max connections database.connections.max (double gauge) |
Maximum number of concurrent connections to the database server. Parameter set at server startup |
| percent usage connections database.connections.usage (double gauge) |
Percentage of used connections (ratio between number of active backends and maximum allowed connections) |
| table count table.count (long gauge) |
Number of tables in this DB |
| function calls function.calls (counter) |
Number of times this function has been called |
| function total time function.time.total (counter) |
Total time spent in this function and all other functions called by it, in milliseconds |
| function self time function.time.self (counter) |
Total time spent in this function itself, not including other functions called by it, in milliseconds |
| index scan indexes.scan (counter) |
Number of index scans initiated on this index |
| returned index entries indexes.rows.read (counter) |
Number of index entries returned by scans on this index |
| fetched rows indexes.rows.feched (counter) |
Number of live rows fetched by index scans |
| lock count lock.count (long gauge) |
Number of active lockable objects |
| sequential scans tables.scan.sequential (counter) |
Number of sequential scans initiated on a table |
| sequential rows fetched tables.rows.fetched.sequential (counter) |
Number of live rows fetched by sequential scans |
| index rows fetched tables.rows.fetched.index (counter) |
Number of live rows fetched by index scans |
| inserted rows tables.rows.inserted (counter) |
Number of rows inserted |
| updated rows tables.rows.updated (counter) |
Number of rows updated |
| deleted rows tables.rows.deleted (counter) |
Number of rows deleted |
| hot updated rows tables.rows.hot.updated (counter) |
Number of rows hot updated (i.e., with no separate index update required) |
| live rows tables.rows.live (long gauge) |
Estimated number of live rows |
| dead rows tables.rows.dead (long gauge) |
Estimated number of dead rows |
| replication delay replication.delay.time (long gauge) |
Replication delay in milliseconds |
| replication delay bytes replication.delay.bytes (long gauge) |
Replication delay in bytes |
| table size table.disk.size (long gauge) |
Disk space used by the a table, excluding indexes (but including TOAST, free space map, and visibility map) |
| index size index.disk.size (long gauge) |
Total disk space used by indexes attached to the a table |
| total size table.total.disk.size (long gauge) |
Total disk space used by the a table, including all indexes and TOAST data |
| read disk blocks statio.heap.blocks.read (counter) |
Number of disk blocks read from a table |
| hit disk blocks statio.heap.blocks.hit (counter) |
Number of buffer hits in a table |
| read index blocks statio.index.blocks.read (tttttt) |
Number of disk blocks read from all indexes on a table |
| hit index blocks statio.index.blocks.hit (counter) |
Number of buffer hits in all indexes on a table |
| read TOAST blocks statio.toast.blocks.read (counter) |
Number of disk blocks read from a table's TOAST table (if any) |
| hit TOAST buffers statio.toast.blocks.hit (counter) |
Number of buffer hits in a table's TOAST table (if any) |
| read TOAST index statio.tidx.blocks.read (counter) |
Number of disk blocks read from a table's TOAST table index (if any) |
| hit TOAST buffer statio.tidx.blocks.hit (counter) |
Number of buffer hits in a table's TOAST table index (if any) |
Logs
Once data is in, you can explore it via the built-in reports:
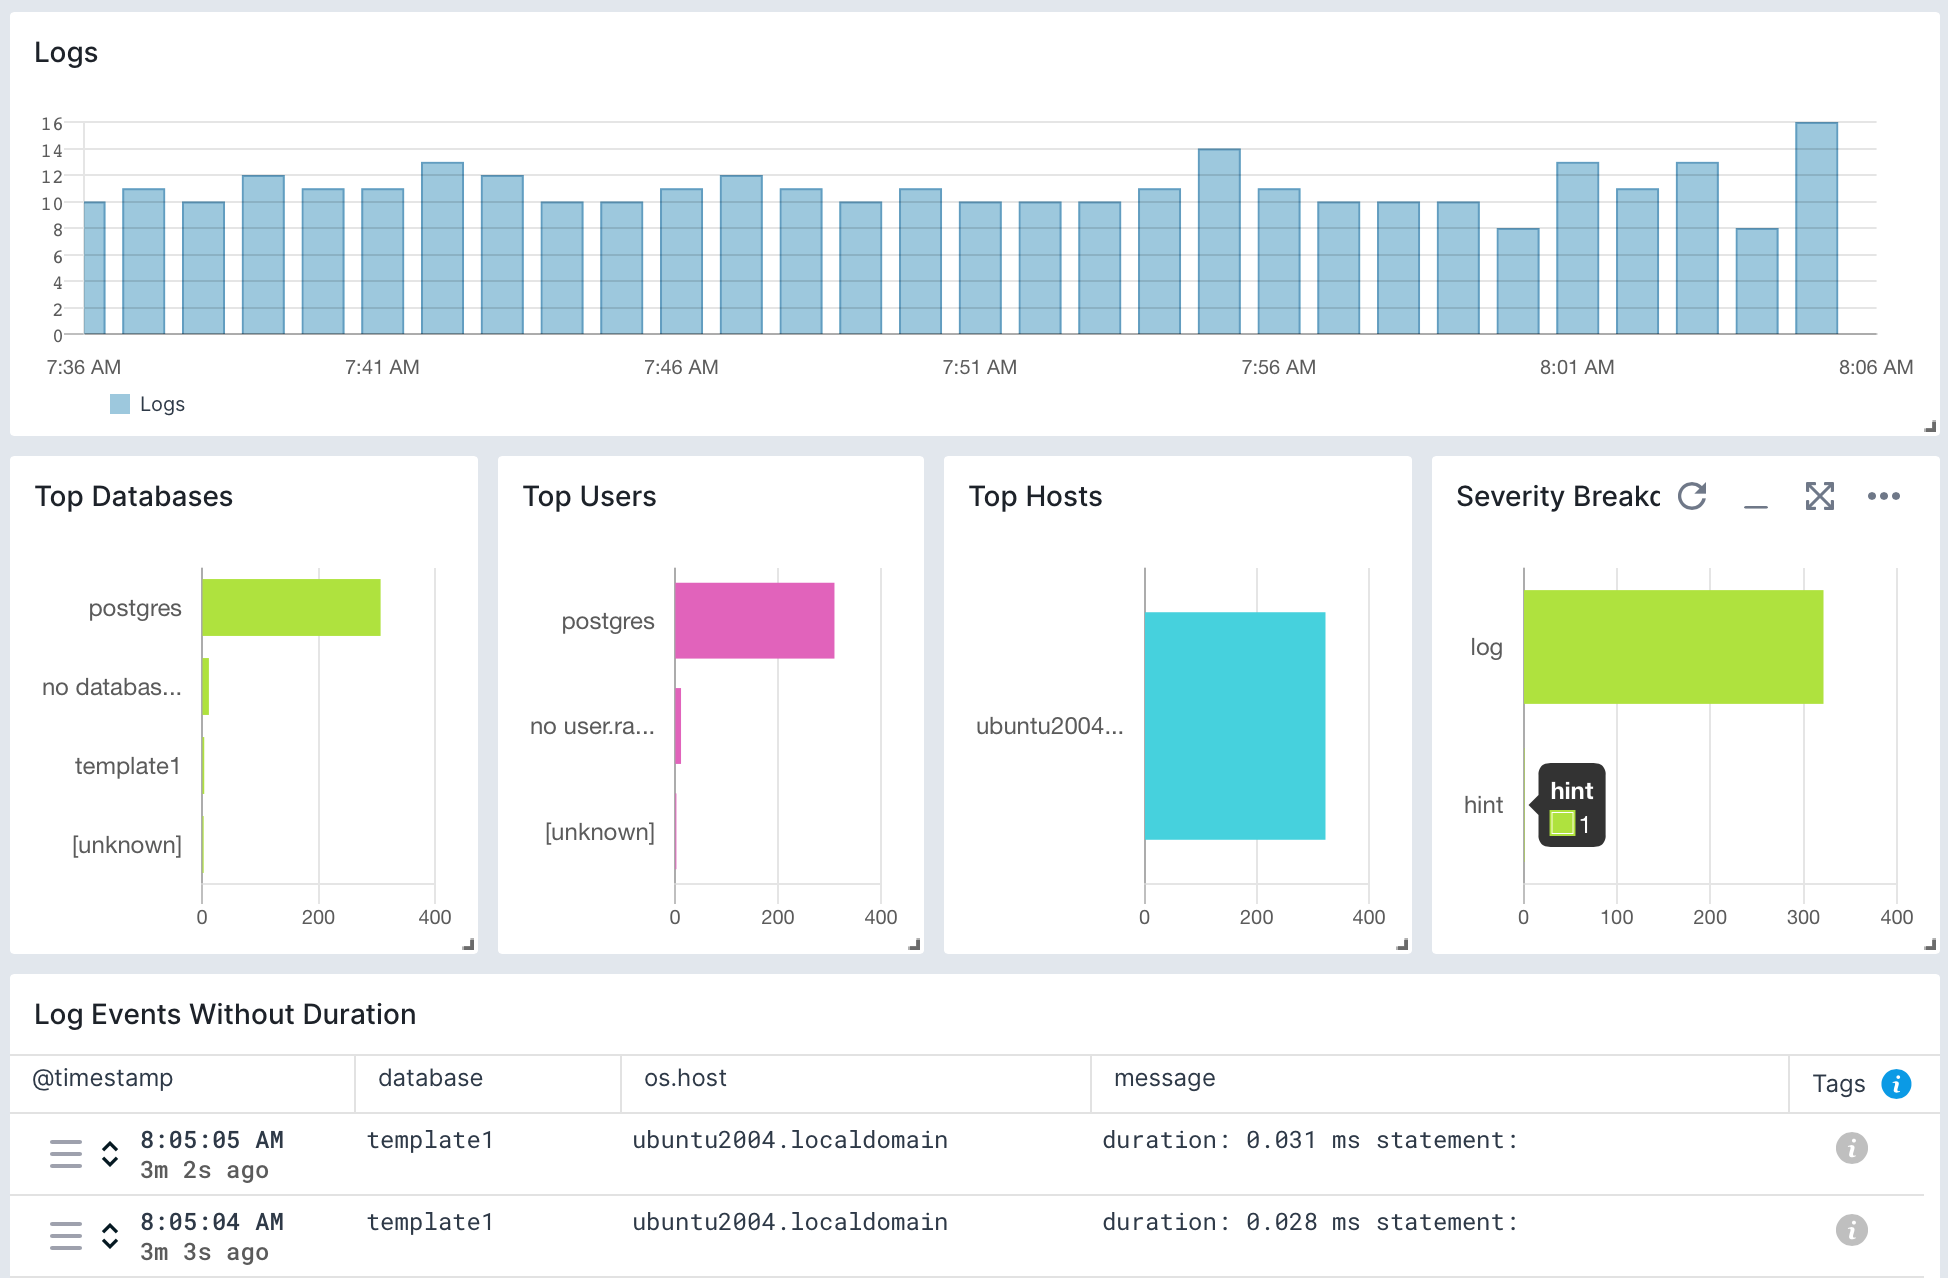
Exploring logs
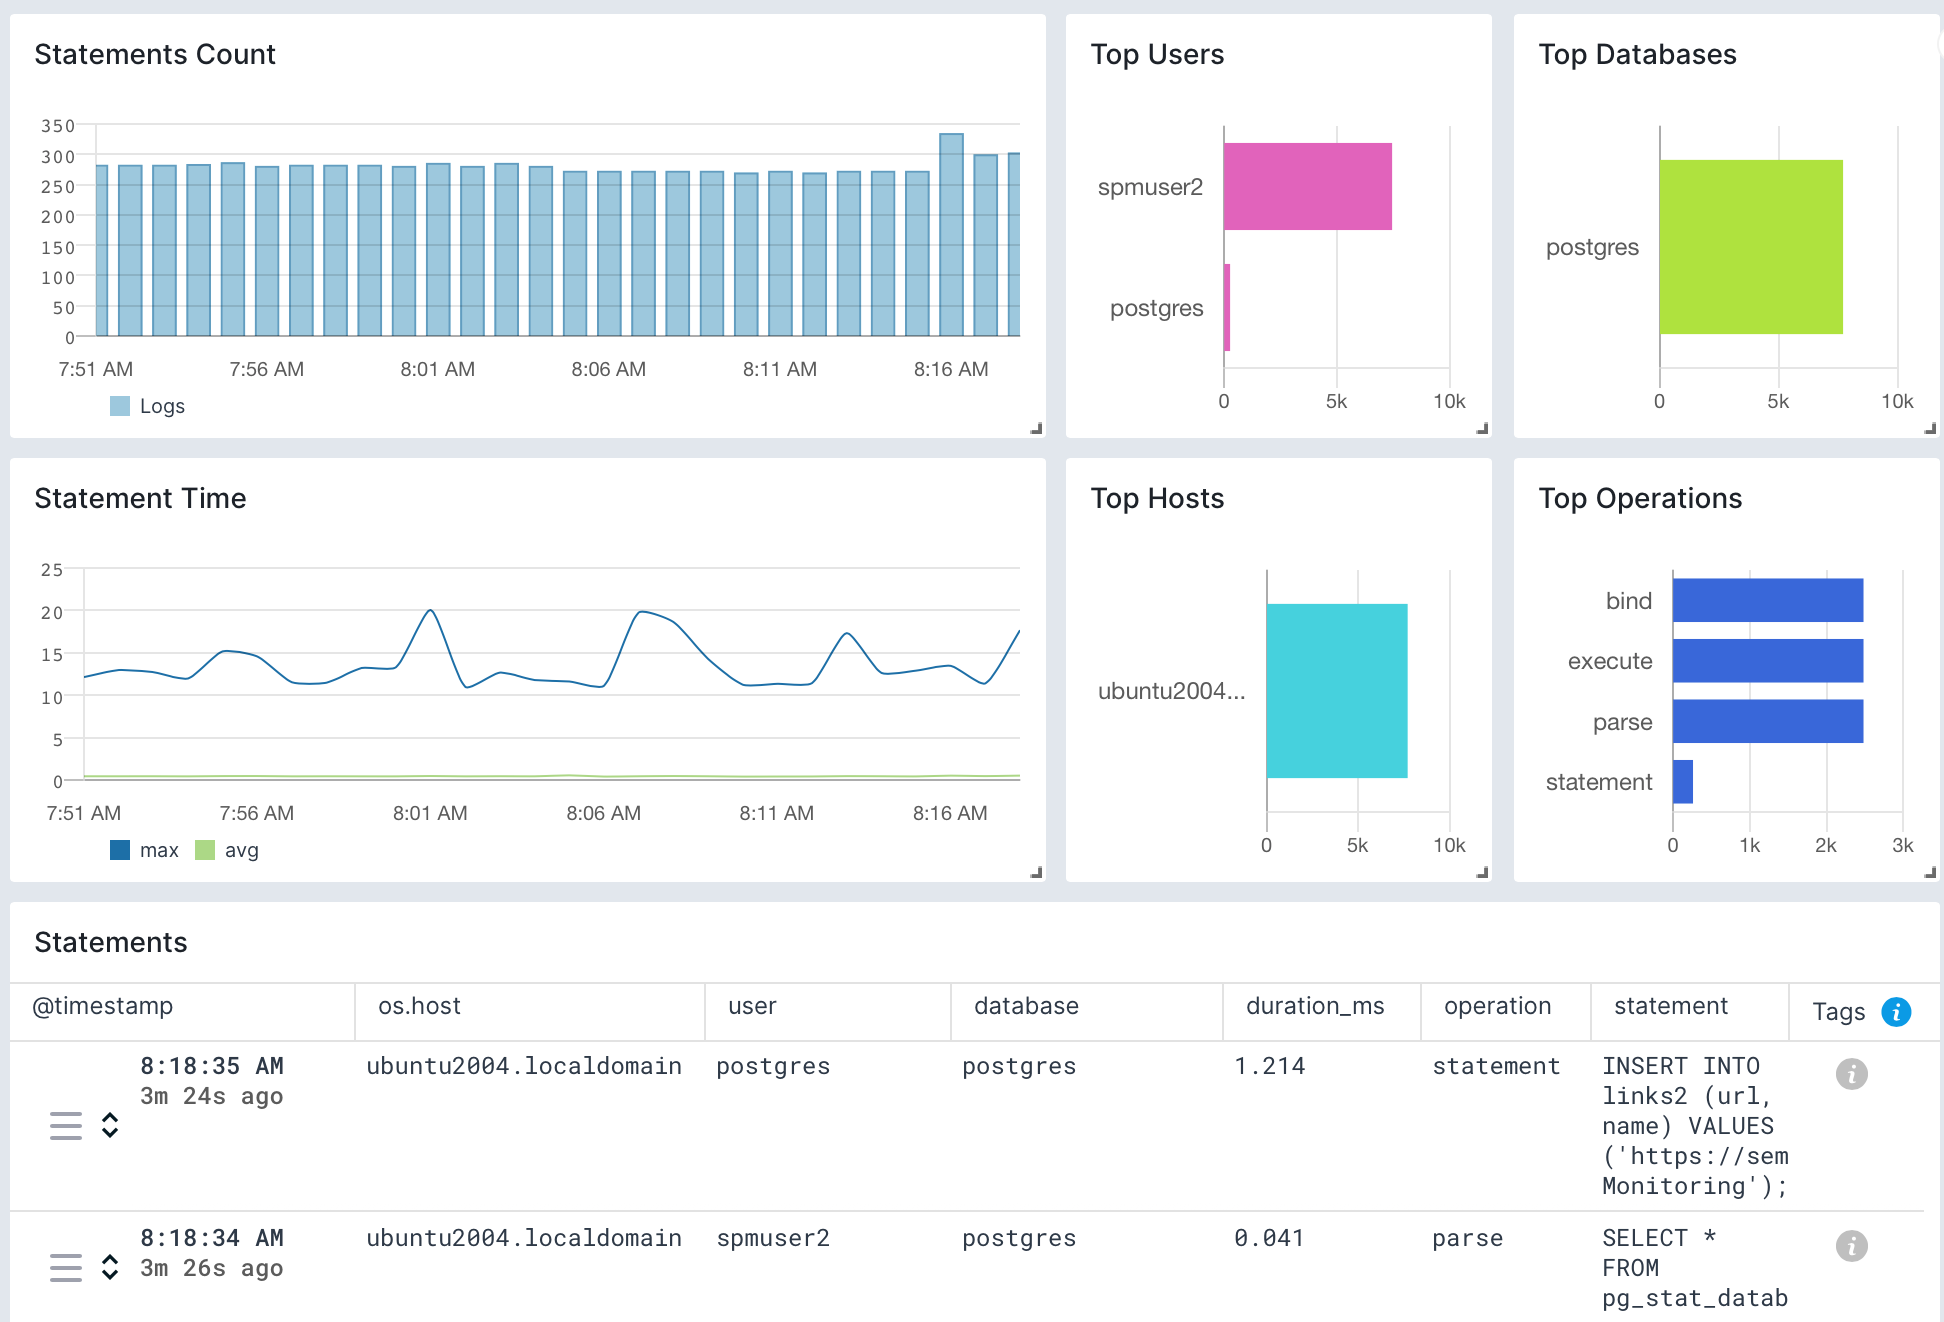
Once data is in, you can explore it using the built-in reports or create your own. For example, you can use the Statement Duration report to check on your queries:
Troubleshooting
If you are having trouble sending logs, try out the latest version of the Sematext Agent. Additionally, make sure to check out the Log Agents panel for any errors, and refer to our Sematext Logs FAQ for useful tips.
If you are having issues with Sematext Monitoring, i.e. not seeing PostgreSQL metrics, see How do I create the diagnostics package.
For more troubleshooting information please look at the Troubleshooting section.