Managed OTLP Endpoint
Sematext Cloud has two ways to receive OpenTelemetry telemetry from your applications:
- Managed OTLP endpoint — your app ships OTLP directly to Sematext's hosted receiver. Recommended for new setups: no extra agent infrastructure, simplest configuration, works from any environment with outbound HTTPS.
- Sematext Agent as a local OTLP receiver — your app ships to a local agent which forwards to Sematext. Use this when you also want infrastructure monitoring (eBPF metrics, Network Map, container/host resource collection) — see Sematext Agent OpenTelemetry.
This page documents the managed OTLP endpoint flow.
When to pick which flow
| You want | Pick |
|---|---|
| Fastest setup, no extra software to install on your hosts | Managed OTLP endpoint |
| One env-var block per service, works in any deployment environment | Managed OTLP endpoint |
| Also collecting host/container metrics via eBPF, Network Map, infra dashboards | Sematext Agent |
| Telemetry credentials kept off application hosts | Sematext Agent |
| Local buffering and batching across many app instances | Sematext Agent |
The two flows can also be mixed — different services in your stack can use different flows and still produce a single distributed trace, since trace context propagates through W3C headers regardless of how each service ships its spans.
Endpoints
| Region | Protocol | OTEL_EXPORTER_OTLP_ENDPOINT |
OTEL_EXPORTER_OTLP_PROTOCOL |
|---|---|---|---|
| US | HTTP (default) | https://otlp-receiver.sematext.com |
http/protobuf |
| US | gRPC | https://otlp-receiver-grpc.sematext.com:443 |
grpc |
| EU | HTTP (default) | https://otlp-receiver.eu.sematext.com |
http/protobuf |
| EU | gRPC | https://otlp-receiver-grpc.eu.sematext.com:443 |
grpc |
Default to HTTP unless you have a specific reason for gRPC (lower per-payload overhead at high volume, etc.). The OpenTelemetry SDKs support both transparently — just pair the right endpoint URL with the matching OTEL_EXPORTER_OTLP_PROTOCOL value.
Region matters
Tokens are region-bound. A US-region token sent to the EU endpoint (or vice versa) silently drops data — no error, no rejection at the SDK level. Pick the endpoint that matches the region of the Sematext Cloud account that owns your Apps.
Authentication
Sematext uses a custom header X-API-TOKEN=<token> instead of the standard Authorization: Bearer … shown in many generic OpenTelemetry examples on the web. The OpenTelemetry SDKs let you pass arbitrary headers via the per-signal headers environment variables, which is the recommended path — works uniformly across all language SDKs.
export OTEL_EXPORTER_OTLP_TRACES_HEADERS=X-API-TOKEN=<tracing-app-token>
export OTEL_EXPORTER_OTLP_LOGS_HEADERS=X-API-TOKEN=<logs-app-token>
export OTEL_EXPORTER_OTLP_METRICS_HEADERS=X-API-TOKEN=<monitoring-app-token>
One token per App
A Tracing App, a Logs App, and a Monitoring App in Sematext Cloud are three separate Apps, each with its own token. The OpenTelemetry HTTP exporter uses per-signal headers (TRACES_HEADERS, LOGS_HEADERS, METRICS_HEADERS), so you map each signal to the right App's token. Omit the header for a signal you're not shipping — the SDK just won't try to export it.
Full env-var block
A complete, ready-to-paste configuration for an EU account shipping all three signals to managed OTLP over HTTP:
# Endpoint + protocol — pick one row from the matrix above
export OTEL_EXPORTER_OTLP_ENDPOINT=https://otlp-receiver.eu.sematext.com
export OTEL_EXPORTER_OTLP_PROTOCOL=http/protobuf

# Per-signal token headers. Omit any line for a signal you're not shipping.
export OTEL_EXPORTER_OTLP_TRACES_HEADERS=X-API-TOKEN=<tracing-app-token>
export OTEL_EXPORTER_OTLP_LOGS_HEADERS=X-API-TOKEN=<logs-app-token>
export OTEL_EXPORTER_OTLP_METRICS_HEADERS=X-API-TOKEN=<monitoring-app-token>

# Service identity — service.name is what you'll see in the UI.
export OTEL_SERVICE_NAME=my-service
export OTEL_SERVICE_VERSION=1.0.0
With auto-instrumentation, this env block plus the SDK's auto-instrumentation hook is all you need to start producing traces and metrics. Logs require manual instrumentation in most language SDKs today — see the per-language pages under OpenTelemetry SDKs.
Compression
The managed OTLP receiver accepts payloads compressed with gzip or zstd (HTTP path uses the Content-Encoding header; gRPC negotiates per-call). At low telemetry volume the savings don't matter much, but for high-volume shipping compression typically reduces payload size 5–10× — meaningful for both bandwidth and receiver throughput.
Enable via the standard OpenTelemetry env var:
gzip is universally supported across OpenTelemetry SDKs and is the safe default. zstd produces smaller payloads but support varies — currently the Go SDK and recent Java SDK releases support it; other languages either don't support it yet or require extra setup. Check your language SDK's documentation before picking it.
Where to get the token
The App creation wizard pre-fills the env vars (with your token already inserted) at the "Send Traces To Sematext" step:
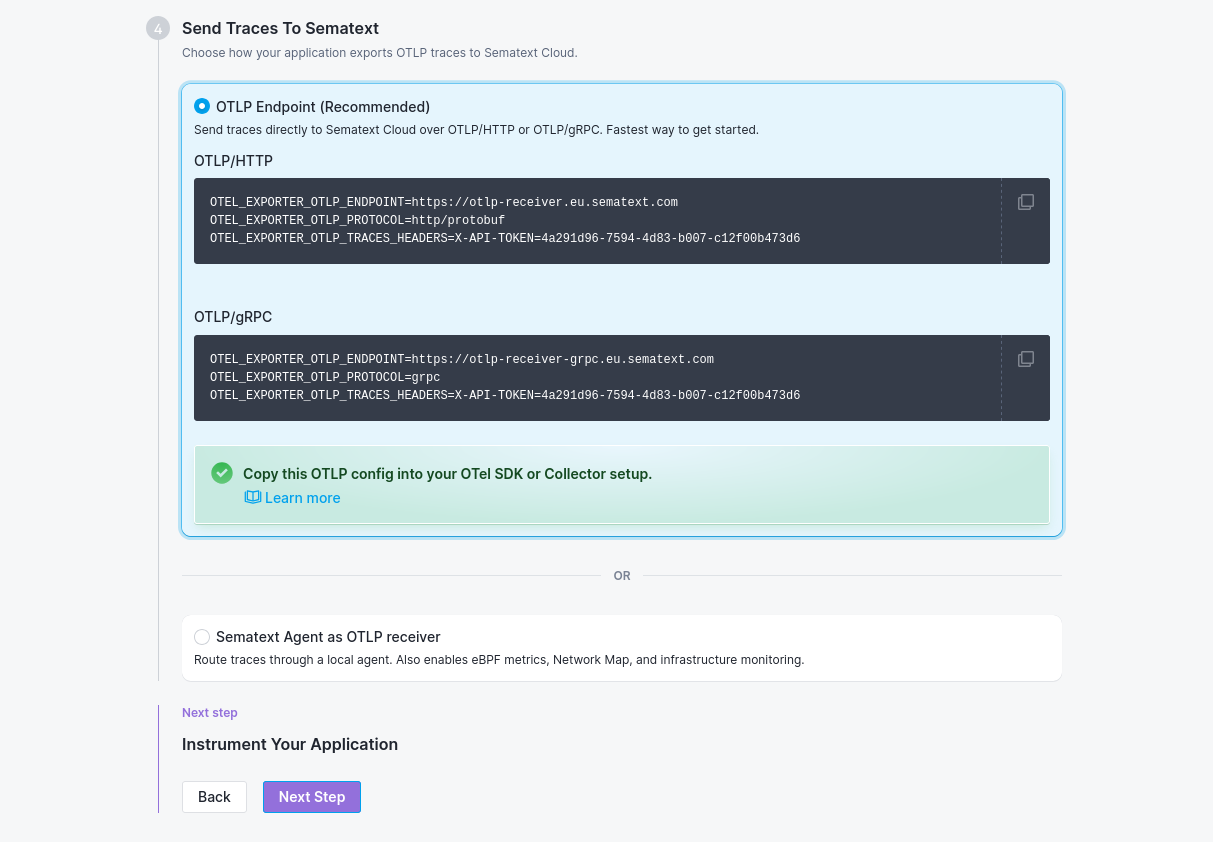
For existing Apps, the token is available in: Sematext Cloud → open the App → Integrations → copy the App token.
Browser-side OpenTelemetry
The managed OTLP endpoint is CORS-enabled, so browser-side OpenTelemetry can POST spans to it directly — no backend proxy required. Point the OTLP exporter at the receiver for your region and authenticate with your Tracing App token.
See the Browser JavaScript SDK guide for the full setup.
Troubleshooting
| Symptom | Likely cause |
|---|---|
| No data within ~60 seconds | Token-region mismatch (US token sent to EU endpoint or vice versa), or the wrong endpoint URL paired with the wrong protocol setting |
Connection refused on the endpoint |
OTEL_EXPORTER_OTLP_PROTOCOL=grpc with the HTTP endpoint URL, or the opposite — pair must match |
401 / 403 from the receiver |
Header is being sent as Authorization: Bearer … instead of X-API-TOKEN=…. Use the OTEL_EXPORTER_OTLP_*_HEADERS env vars rather than hand-coding the exporter. |
| Traces ship but metrics don't (or vice versa) | The signal-specific header isn't set, or the SDK's auto-instrumentation doesn't enable that signal by default — many language SDKs require a flag to opt into metrics |
Related
- AI-Powered OTel Onboarding — interactive setup walkthrough
- Sematext Agent OpenTelemetry — the alternative flow
- Setup OpenTelemetry with Sematext Cloud for Metrics and Logs — Logs App + Monitoring App onboarding via the agent
- Creating a Tracing App
- OpenTelemetry SDKs — per-language reference
- sematext-otel-onboarding repository — runnable reference examples per language and an end-to-end multi-service demo