Logs Correlation
The Logs tab in the failed run flyout finds logs from connected Logs Apps that match the failed request. Depending on your setup, logs are matched by exact trace ID or by URL and time window.
Connecting a Logs App
If you don't have a Logs App, the Logs section in the Troubleshoot tab will prompt you to create one and connect it to your Synthetics App automatically. If you already have Logs Apps in your account, you can select and connect the relevant one directly from the same tab.
We recommend using the OpenTelemetry Logs integration for two reasons: if you expose your trace ID in response headers, Sematext can filter logs to the exact failing request; and even without a trace ID, OTel logs are structured and enriched, making it easier to spot errors and correlate across services. The Sematext OpenTelemetry Examples repo includes log shipping examples alongside the tracing and metrics setup.
If Sematext detects a known service on the monitored host, such as Nginx or Apache, it will also suggest creating a service-specific Logs App. These come with out-of-the-box dashboards and alerts tailored to that service. Connecting both gives you application-level events from OTel logs and infrastructure-level events from the service logs in one place.
How Logs Are Matched
With a Trace ID
This applies to OpenTelemetry Logs Apps and is the recommended way to correlate logs. If your backend includes the active trace ID in its HTTP response headers, Sematext reads it from the monitor run result and uses it to filter logs to that exact request. See Expose Trace ID in Response Headers to set this up.
This eliminates noise from unrelated requests that happened around the same time and takes you directly to the logs for the specific request that triggered the monitor failure.
Without a Trace ID
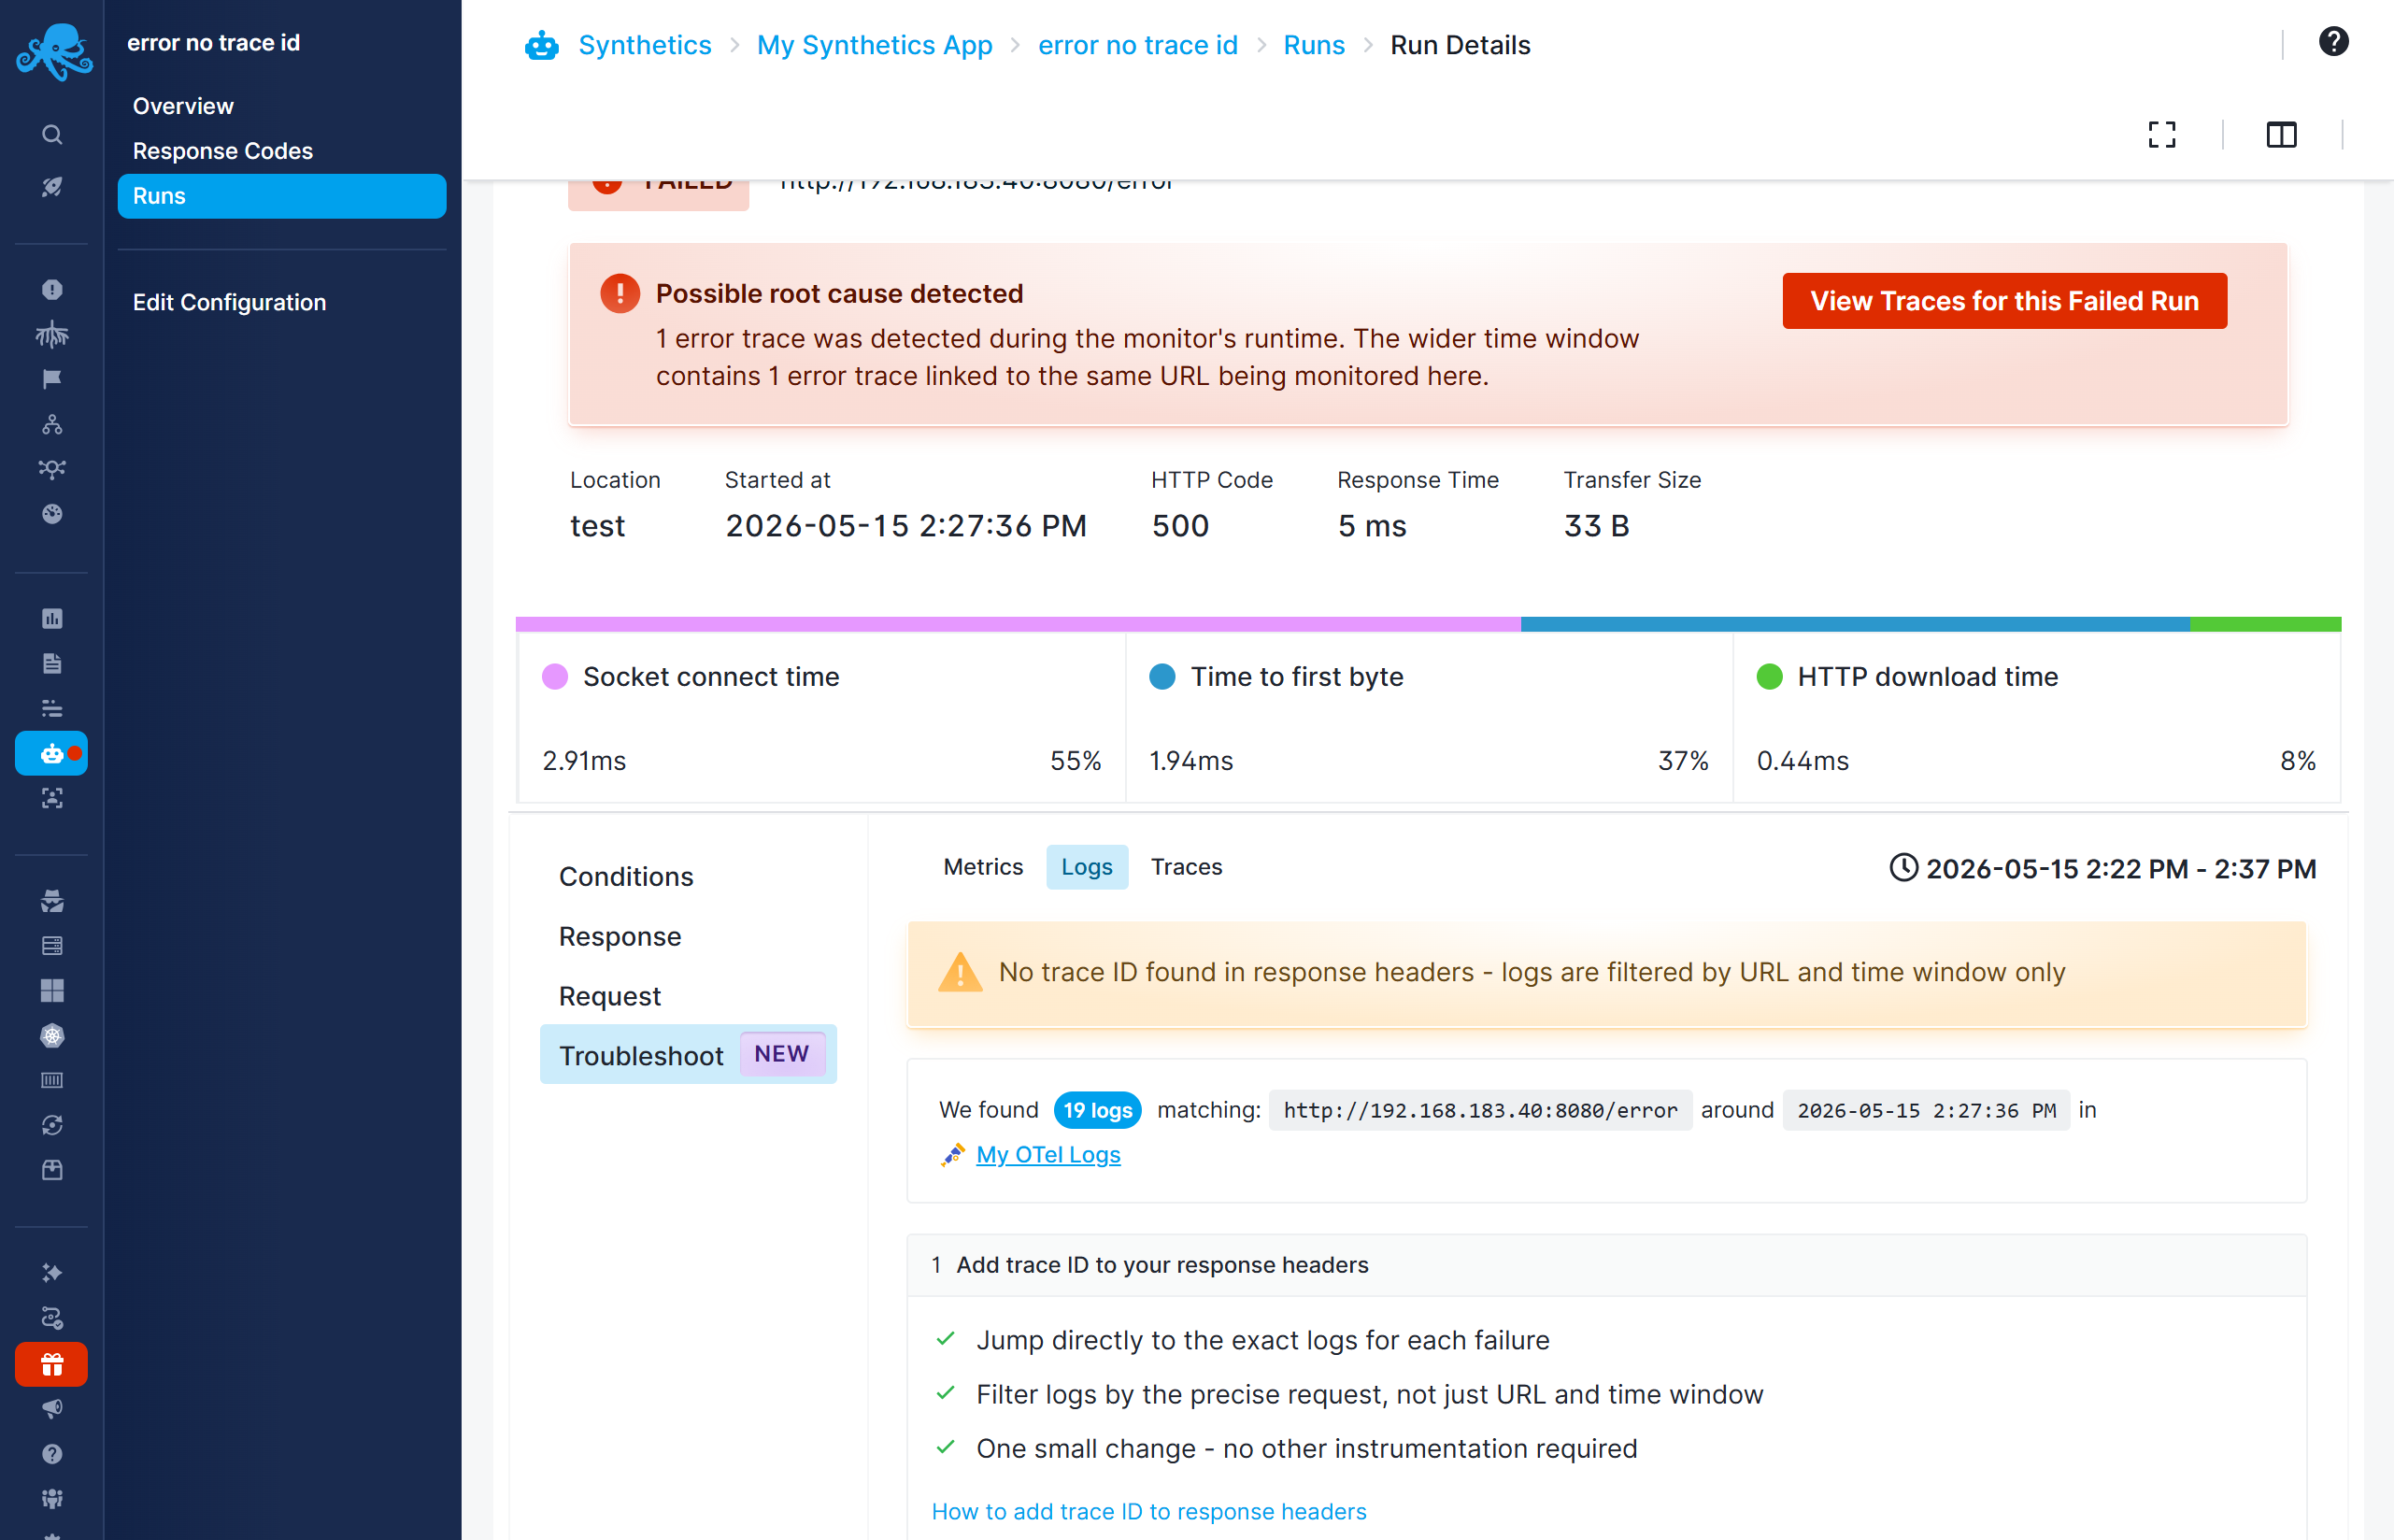
If your backend does not include a trace ID in its response headers, logs are matched by the monitored URL and the time window around the failure. The tab shows the number of matching logs — open them in a new tab by clicking the Logs App link.
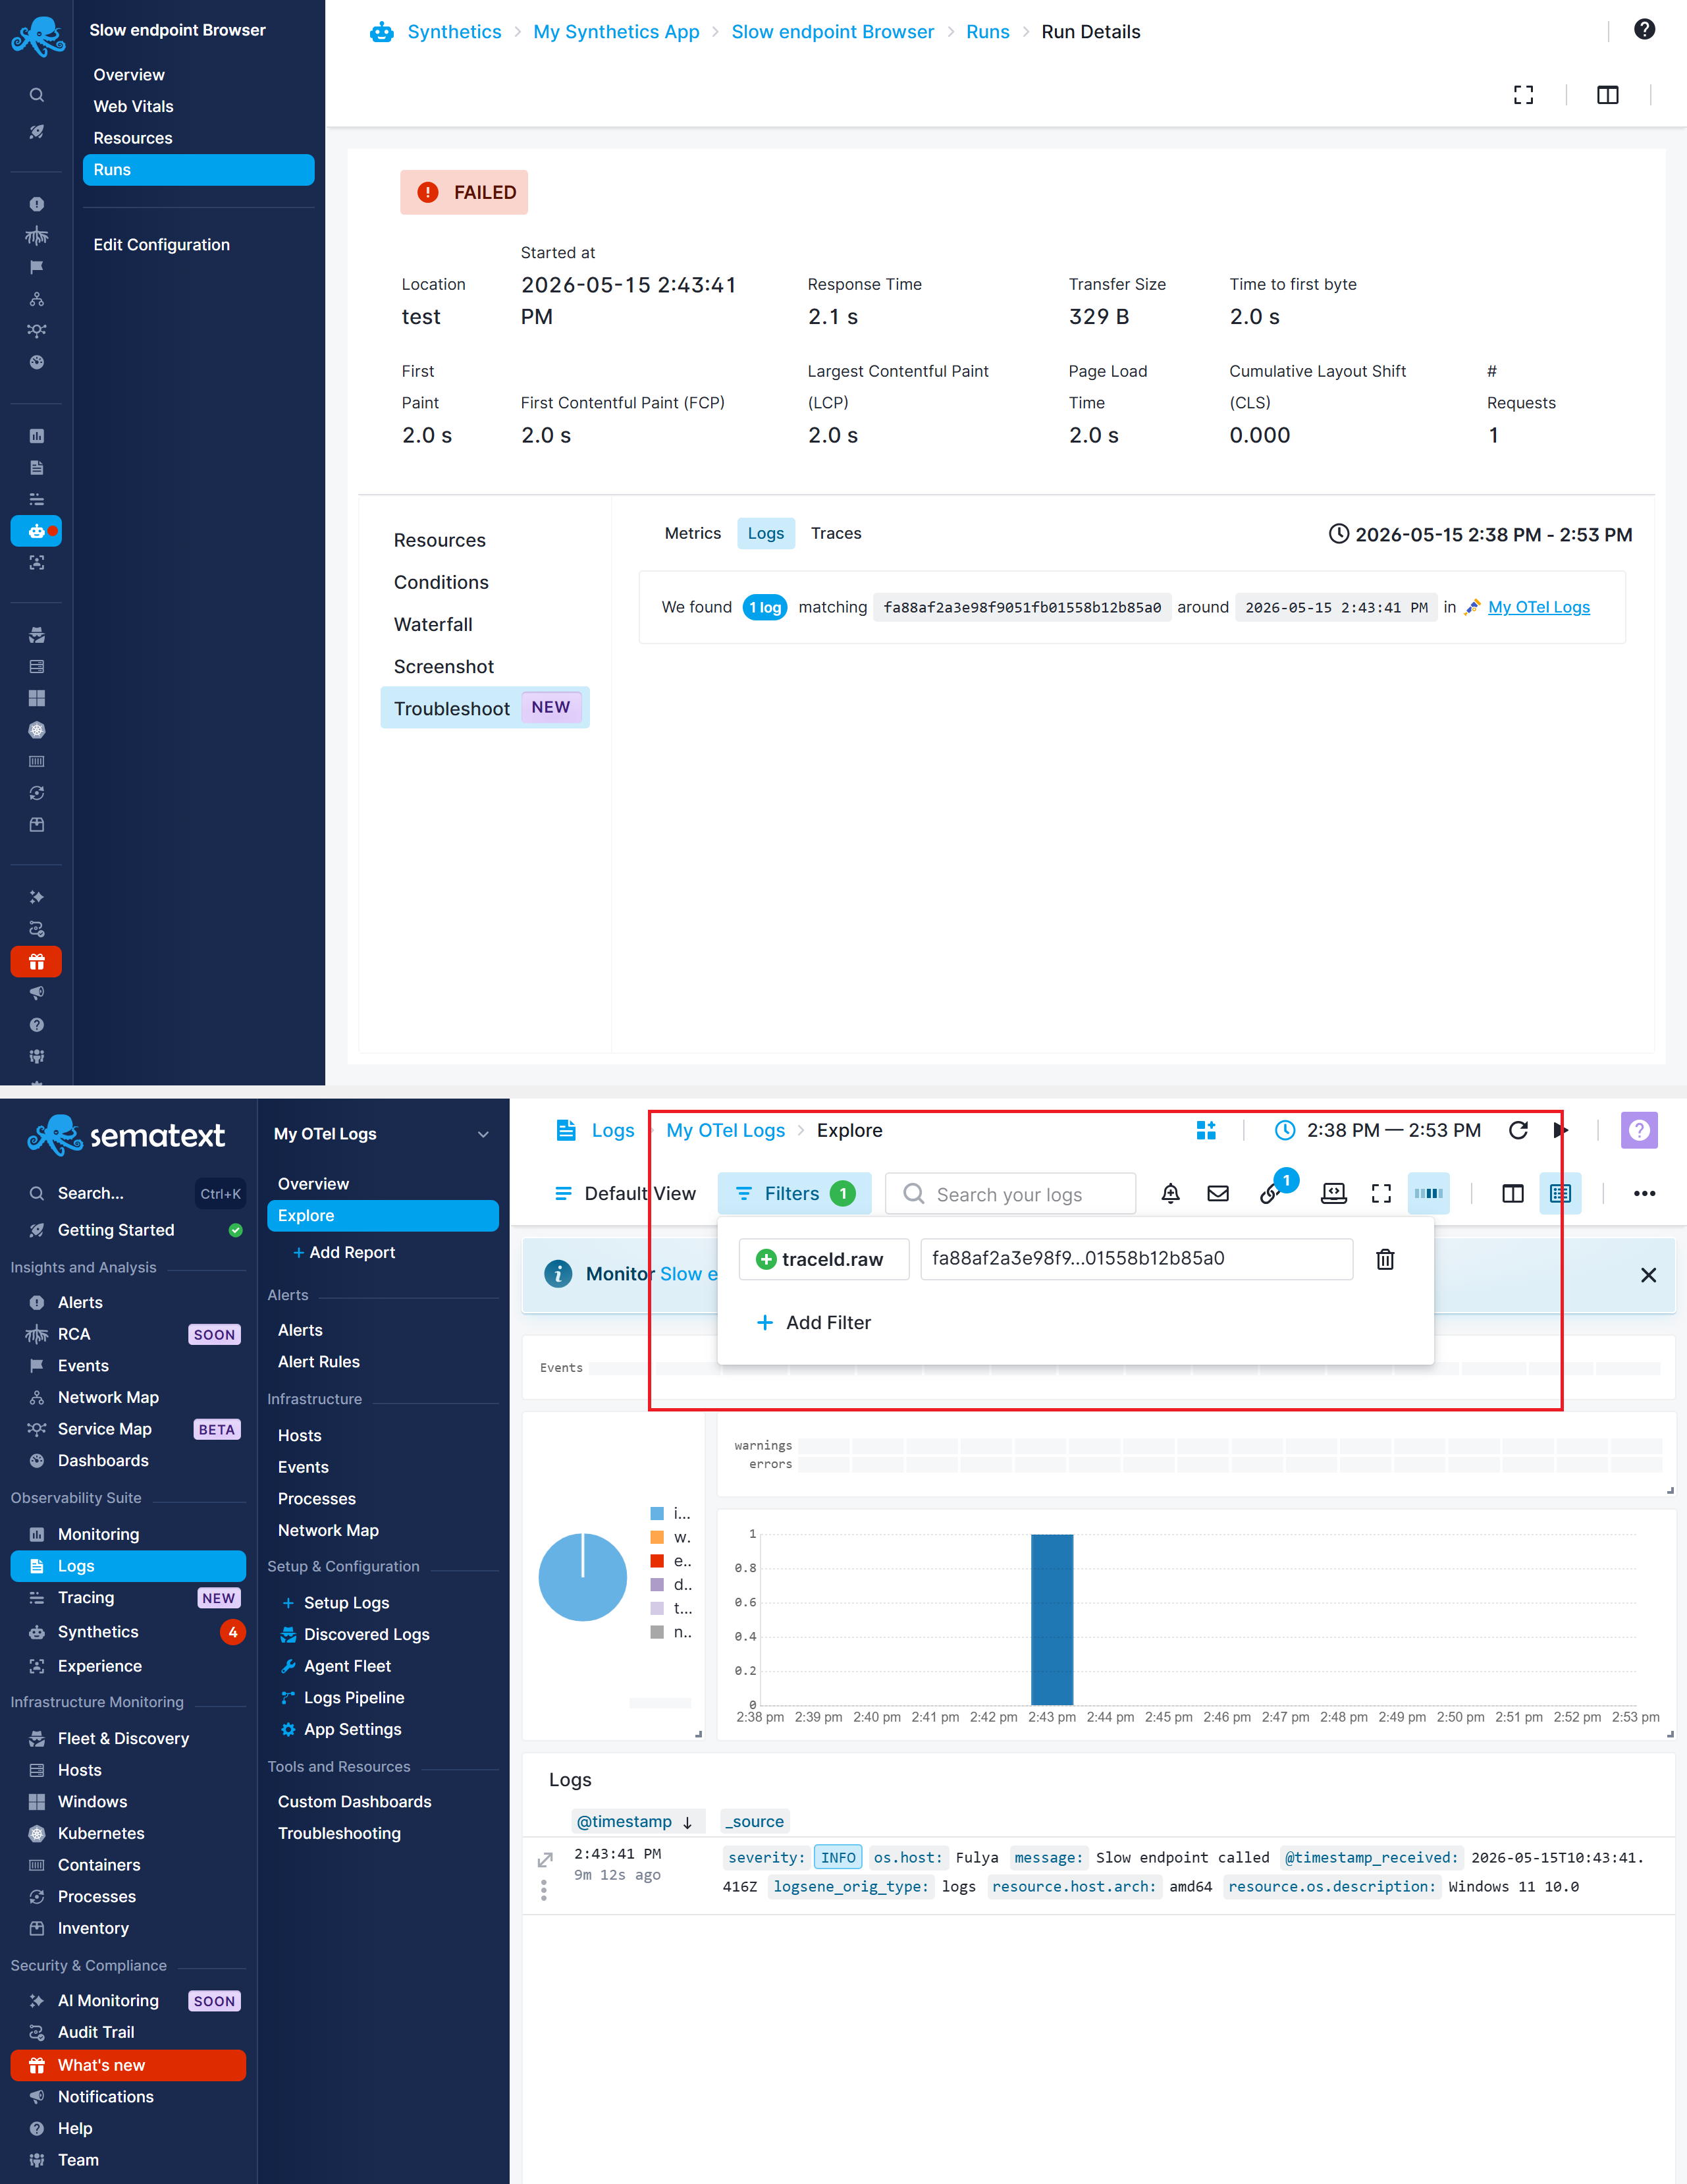
Exploring Logs
Once you open the Logs App from this tab, filters are applied automatically — the URL and time range, or the trace ID if available.