Metrics Correlation
The Metrics tab in the failed run flyout lists all Monitoring Apps connected to your Synthetics App. It gives you a direct path to the metrics of the services hosting your monitored endpoint, scoped to the time of the failure.
Connecting a Monitoring App
If you don't have a Monitoring App yet, the Metrics section in the Troubleshoot tab will prompt you to create one and connect it to your Synthetics App automatically. If you already have Monitoring Apps in your account, you can select and connect the relevant one directly from the same tab.
We recommend using the OpenTelemetry Metrics integration — it produces structured, enriched telemetry that correlates well across signals and gives you more context when investigating failures.
If Sematext detects a known service on the monitored host, such as Nginx or Apache, it will also suggest creating a service-specific Monitoring App. These come with out-of-the-box dashboards and alerts tailored to that service, so you can start monitoring what matters immediately after installing the Sematext Agent on your host.
Using the Metrics Tab
Once a Monitoring App is connected, it appears in the Metrics tab when a monitor run fails.
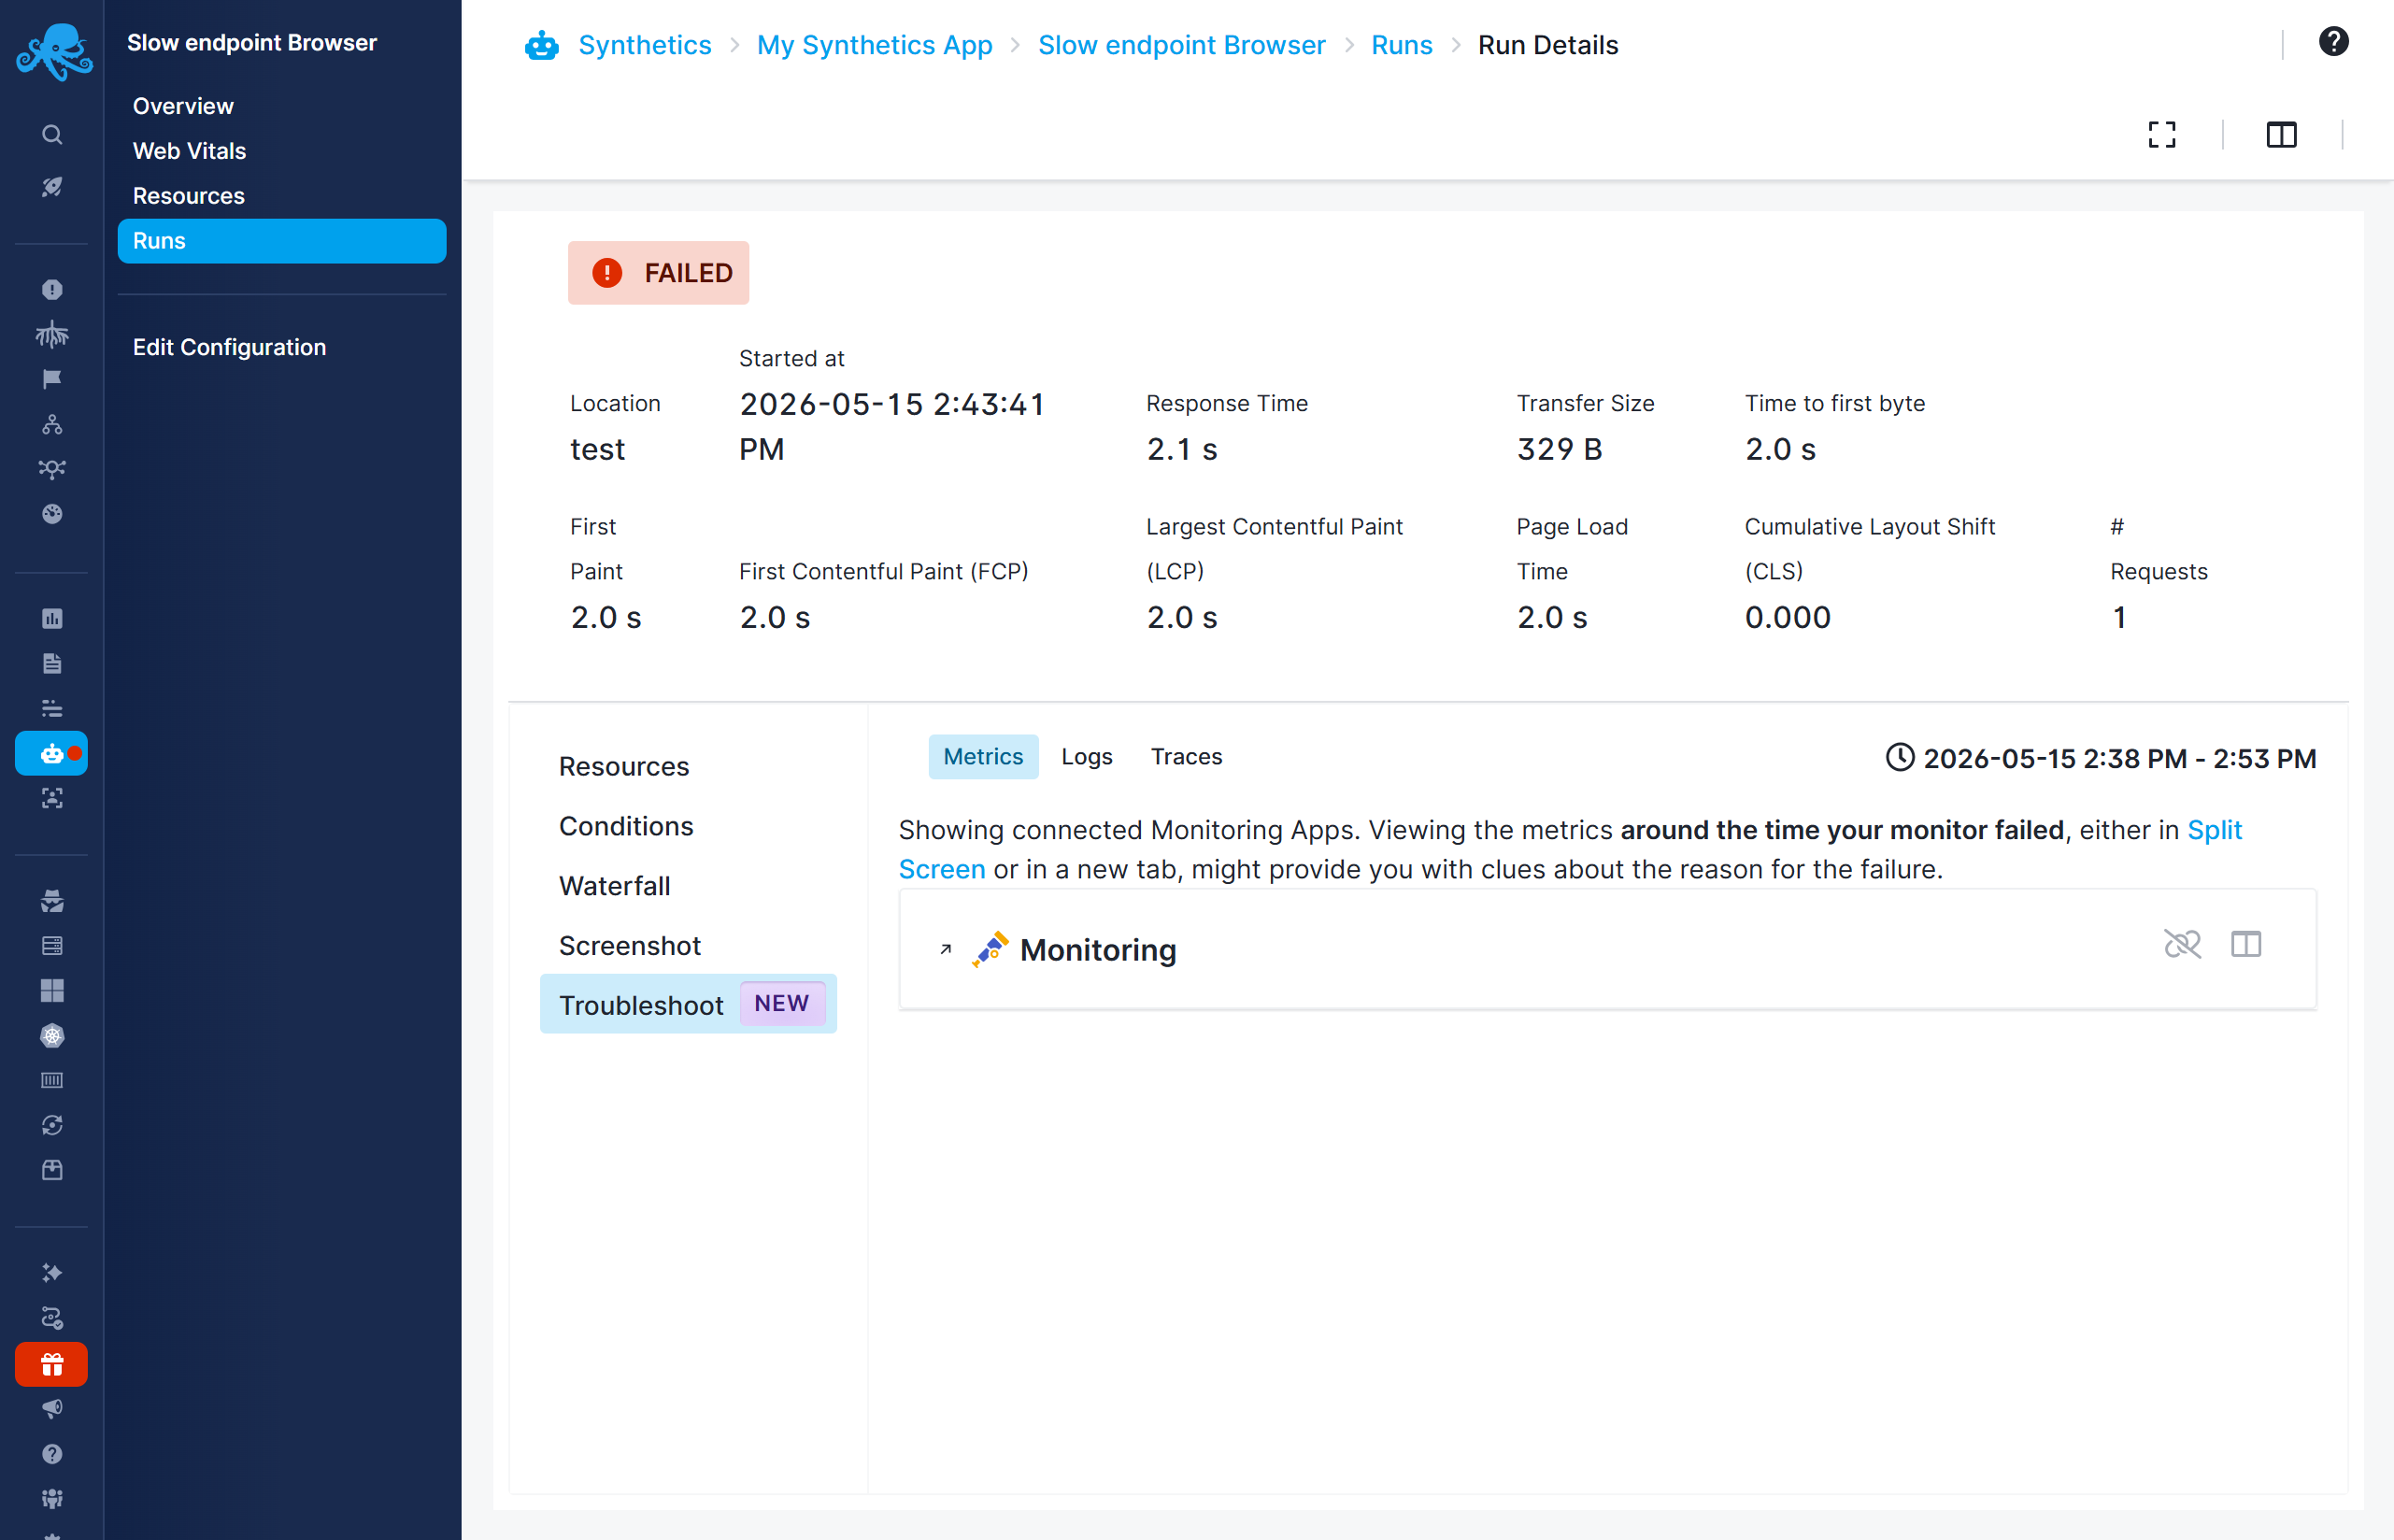
Click the App name to open it in a new tab. The Monitoring App opens with the time range pre-set to around the time of the failure. From there, check for anomalies that coincide with the failure:
- CPU and memory spikes
- Elevated error rates or dropped request counts
- Database connection pool exhaustion or high query latency
- Network throughput drops