Traces Correlation
The Traces tab in the failed run flyout finds distributed traces from connected Tracing Apps that match the failed request. Depending on your setup, traces are matched by exact trace ID or by URL and time window.
Connecting a Tracing App
If you don't have a Tracing App yet, the Traces section in the Troubleshoot tab will prompt you to create one and connect it to your Synthetics App automatically. If you already have Tracing Apps in your account, you can select and connect the relevant one directly from the same tab.
To learn how to create a Tracing App and instrument your services to start shipping traces, see Getting Started with Tracing and the OpenTelemetry SDKs documentation. The Sematext OpenTelemetry Examples repo shows end-to-end how to instrument and ship traces, which is exactly what someone setting up a Tracing App needs.
How Traces Are Matched
With a Trace ID
This is the recommended way to correlate traces. If your backend includes the active trace ID in its HTTP response headers, Sematext reads it from the monitor run result and uses it to find the exact trace for that request. See Expose Trace ID in Response Headers to set this up.
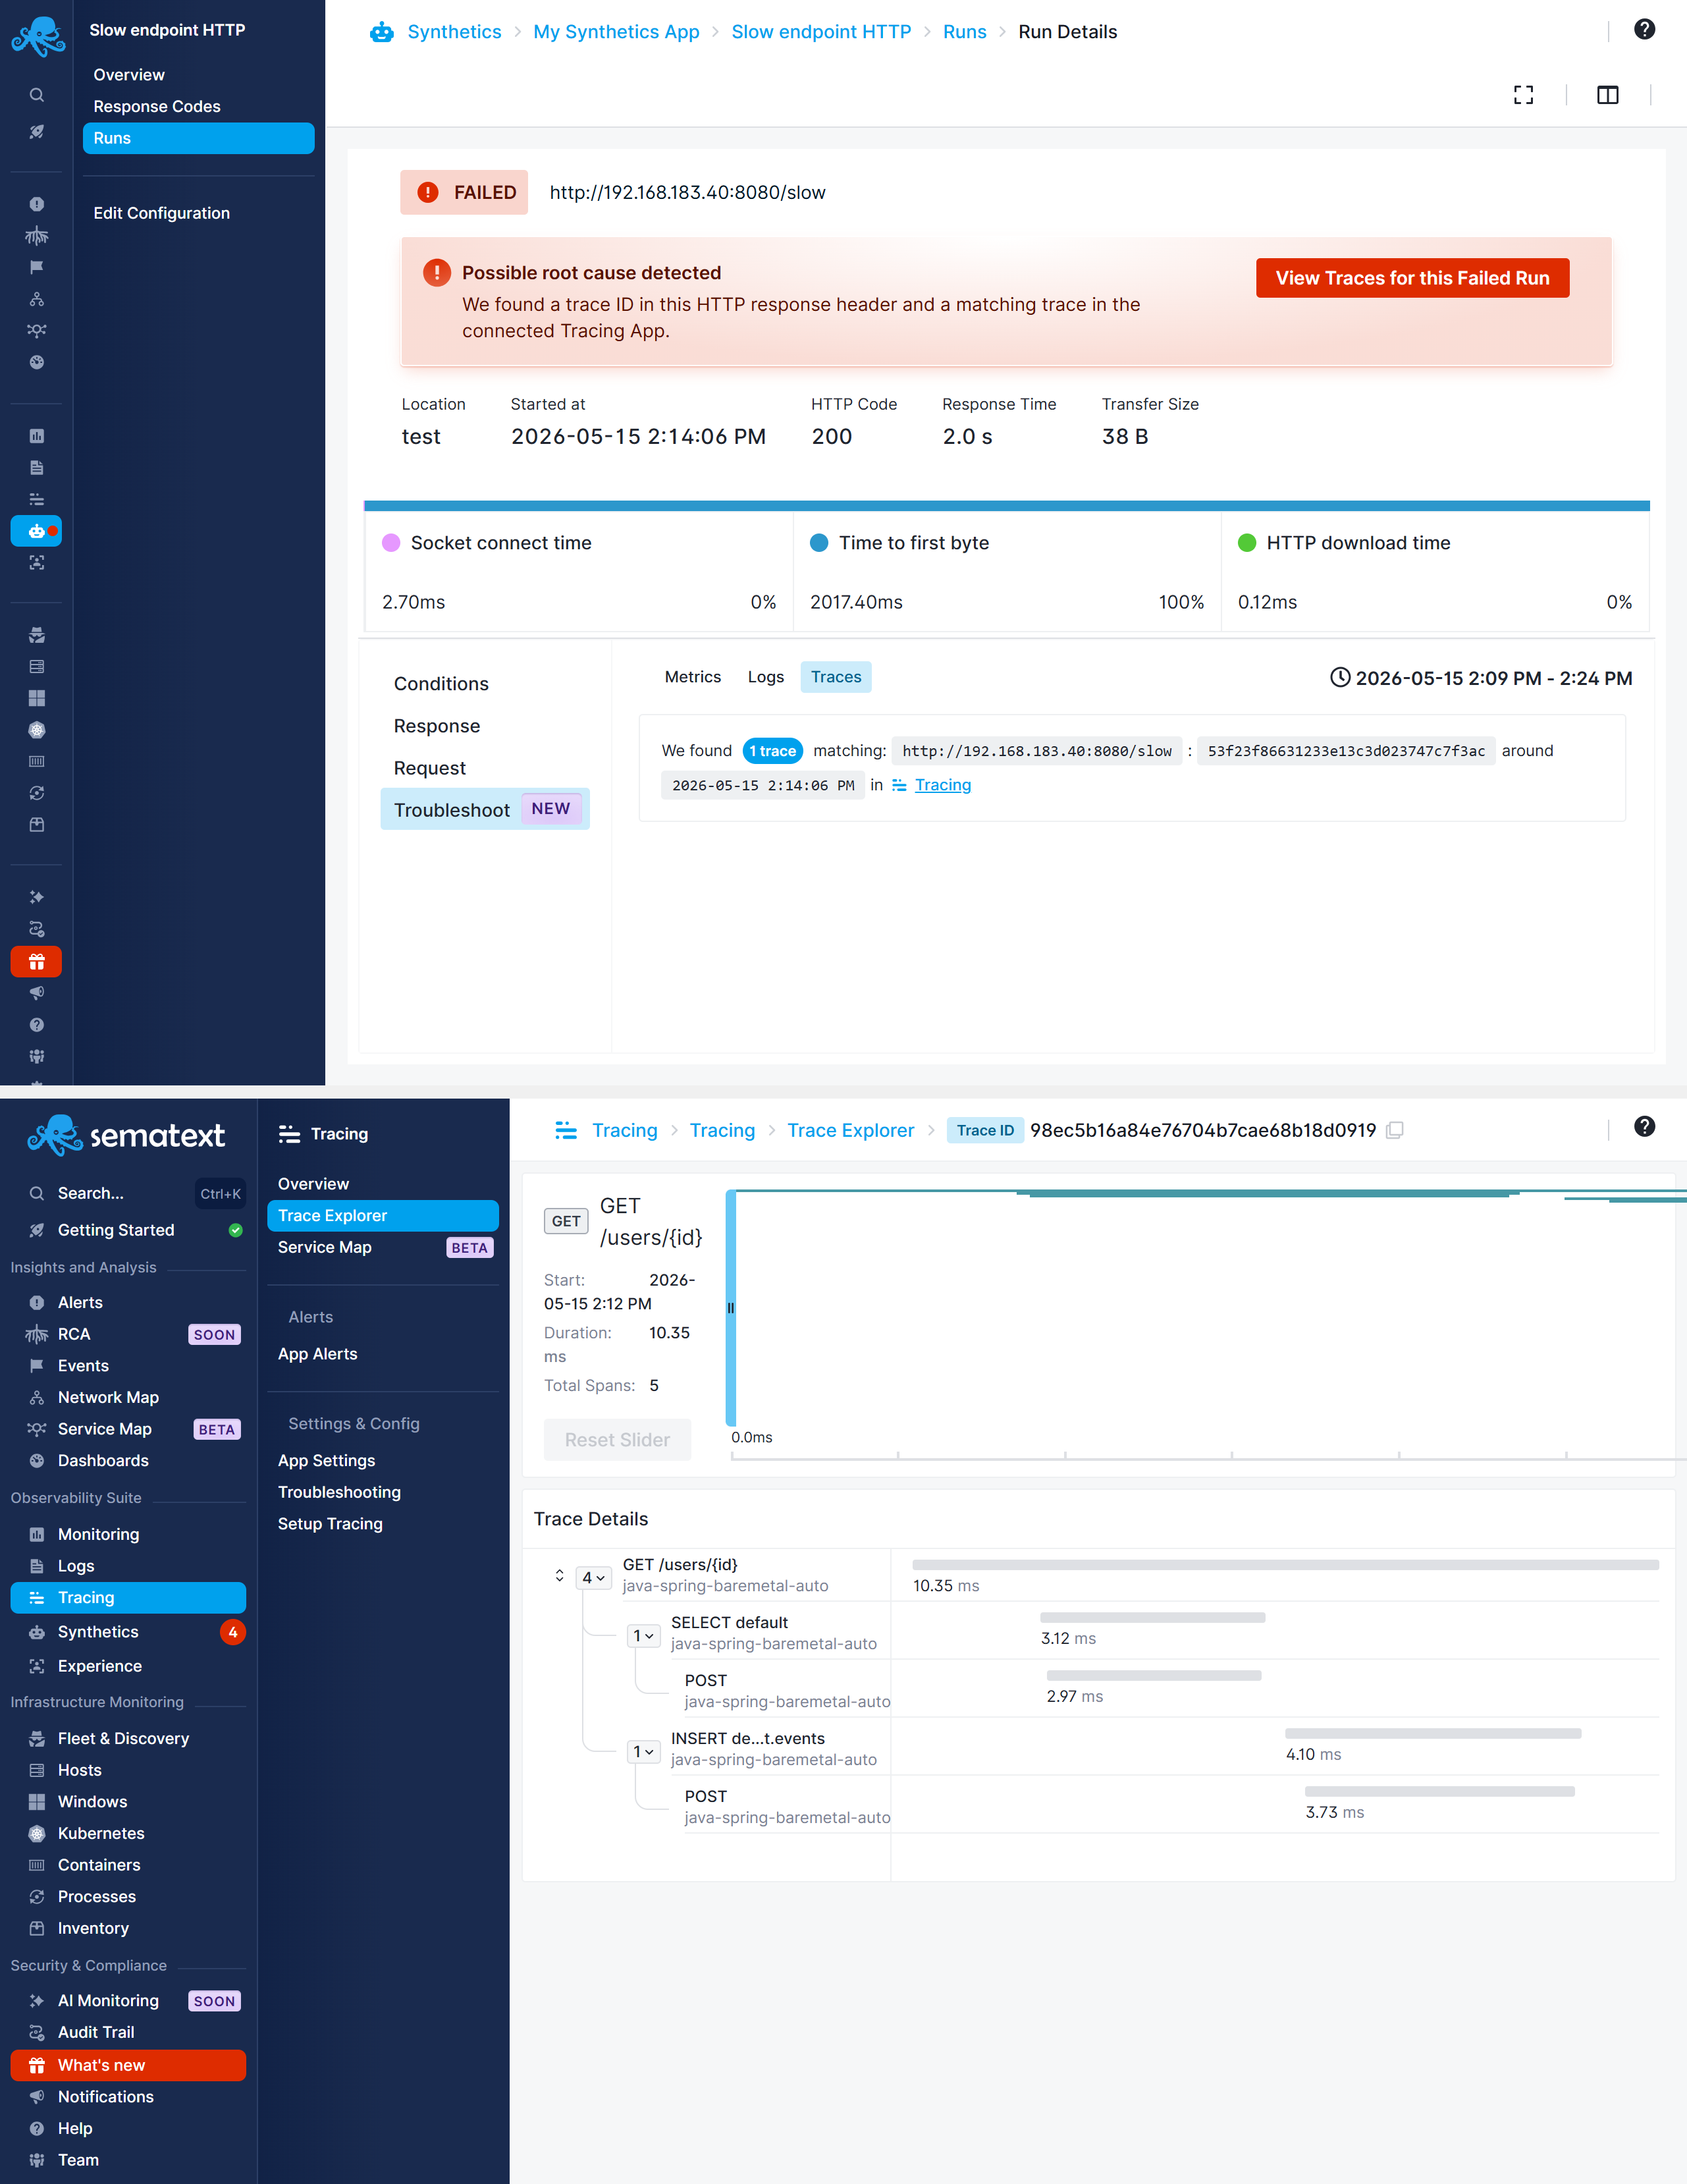
This takes you directly to the trace for the specific request that failed, showing the full journey through your backend services. From the trace view you can identify:
- Slow database queries
- Service timeouts
- Error propagation across microservices
- Third-party API failures
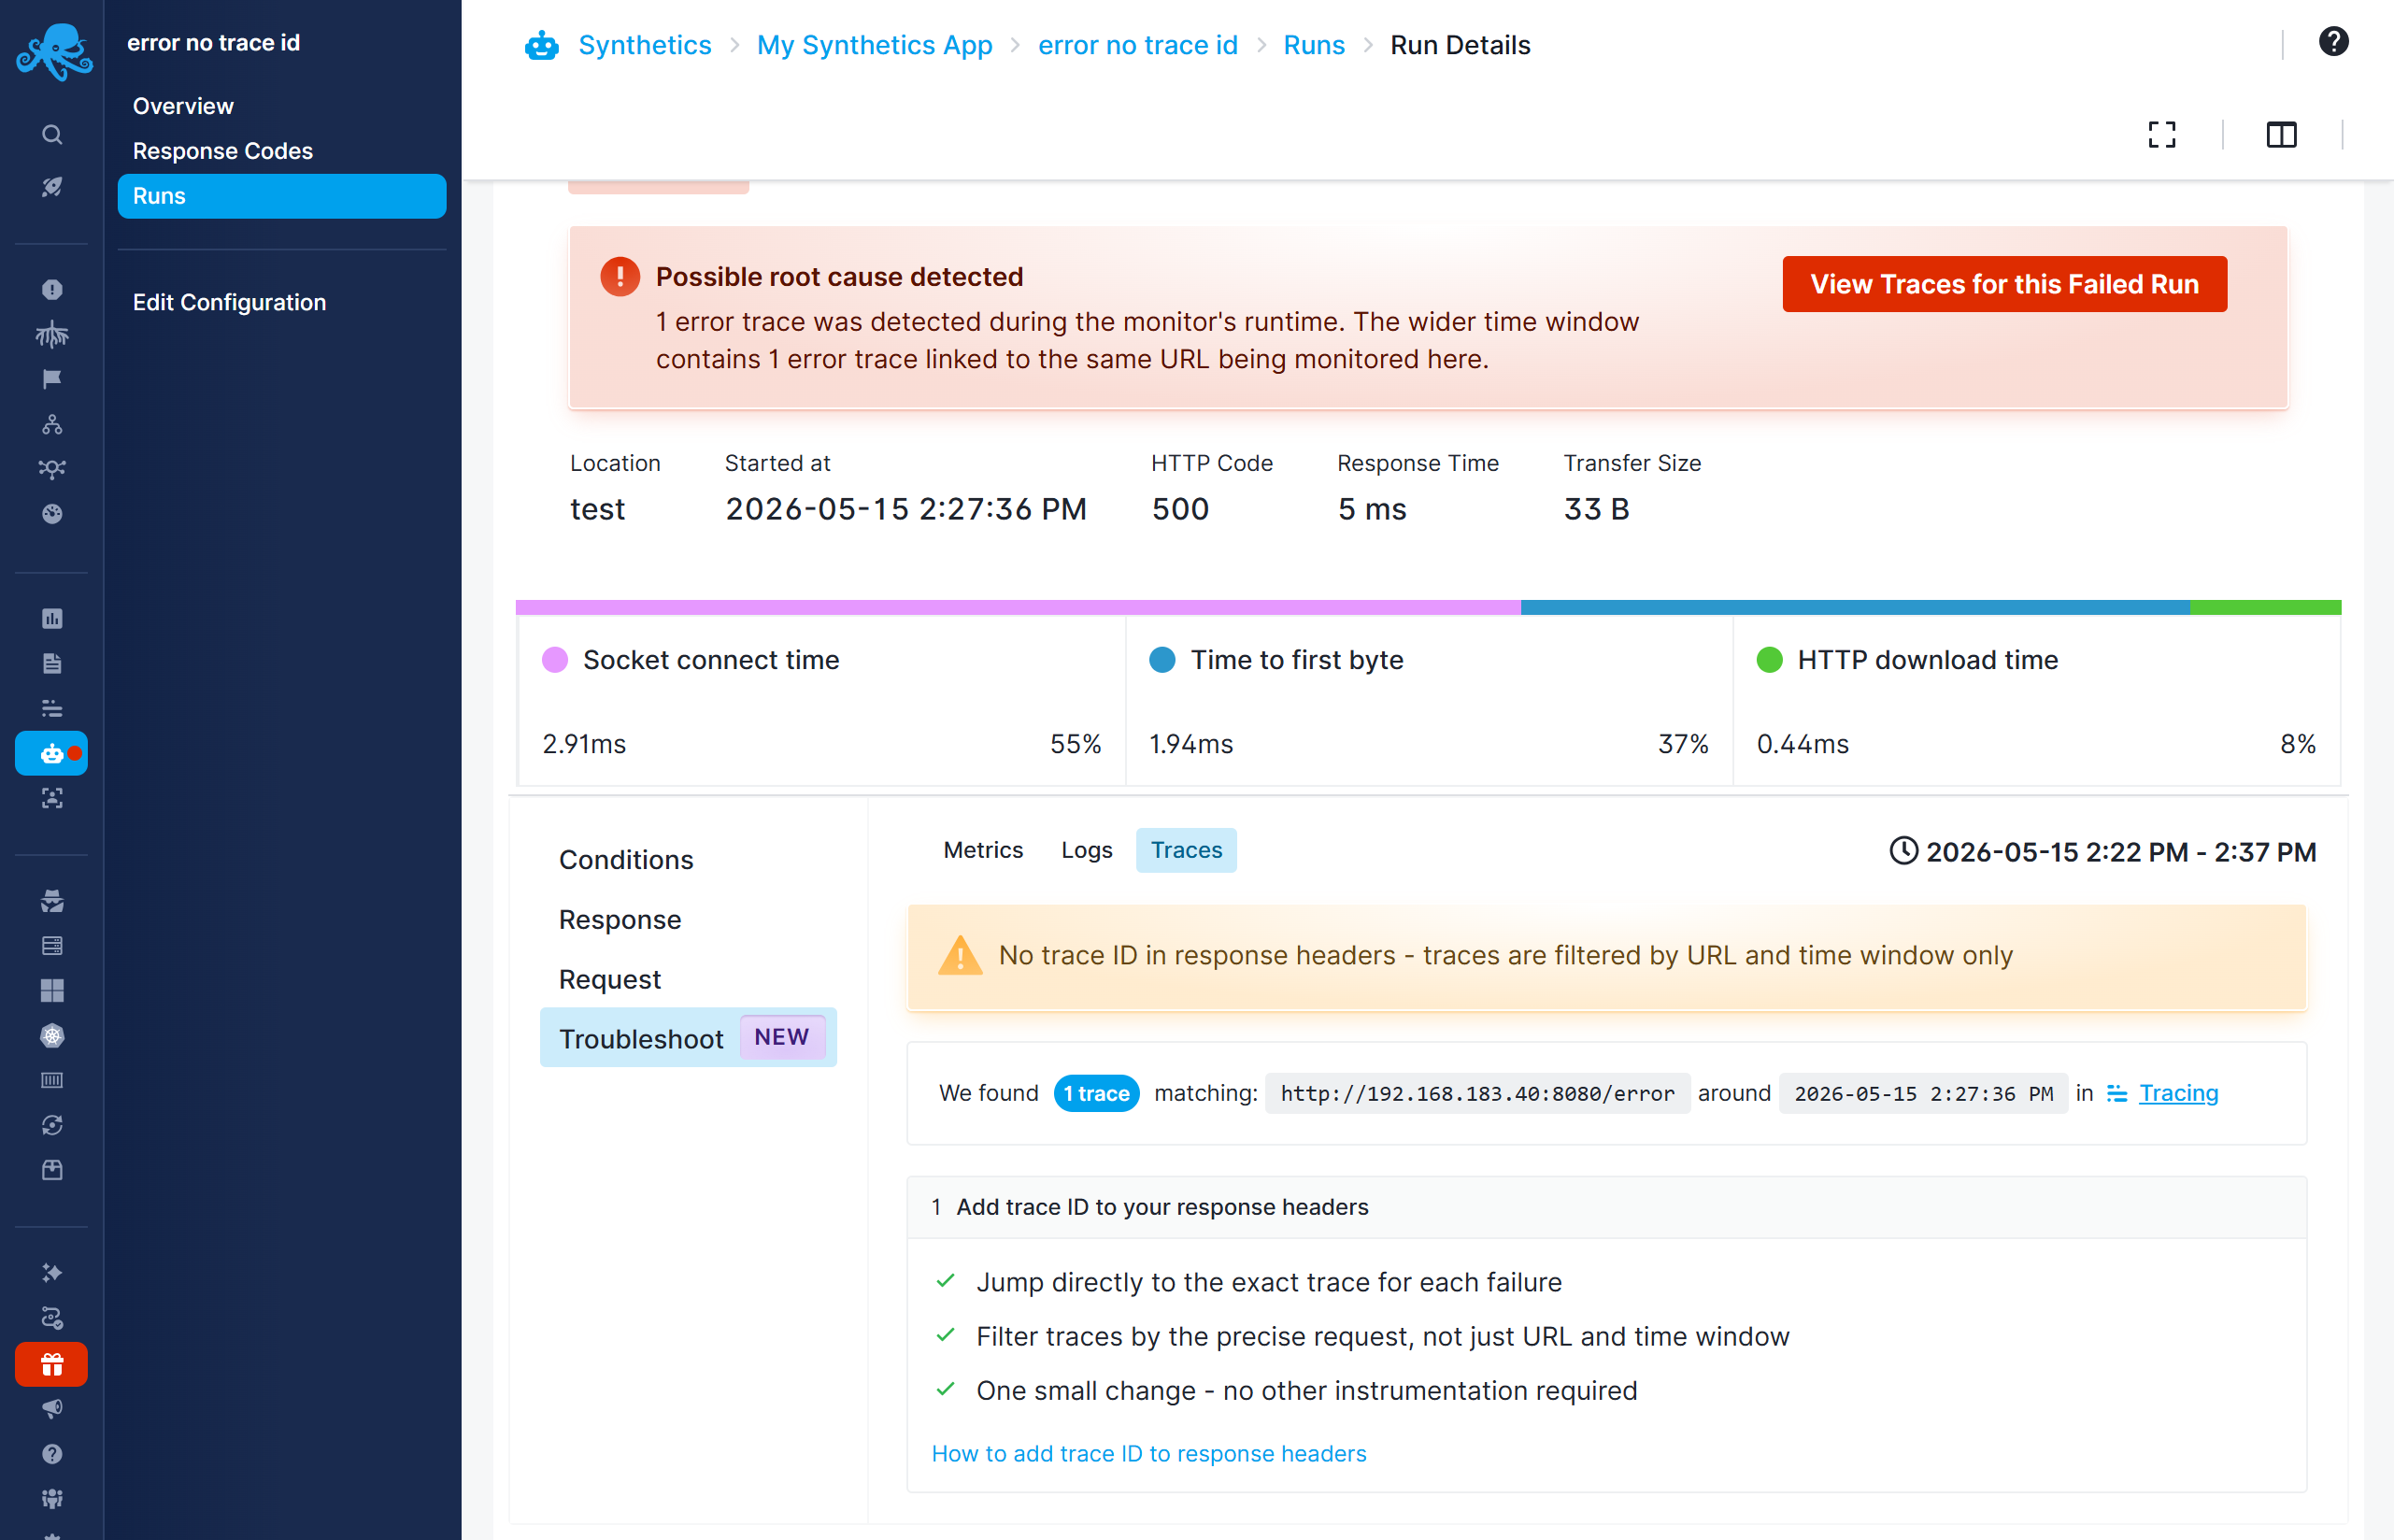
Without a Trace ID
If your backend does not include a trace ID in its response headers, traces are matched by the monitored URL and the time window around the failure. There may be multiple matching traces — you can open them in a new tab by clicking the Tracing App link.
No Matching Traces Found
If no traces are found for the URL and time window, the likely causes are:
- The monitored endpoint is not instrumented with OpenTelemetry
- Traces are being sent to a different Tracing App than the one connected
- The service name in the agent configuration does not match what's expected
Check your OpenTelemetry SDK setup and verify that traces from the monitored endpoint appear in the connected Tracing App.