Reports
AI Agent Watch ships with a set of built-in reports, available from the left-hand menu: Overview, Explore, Agent Sessions, PII Detections, Network Events, Tool Execution, and Governance.
Shared elements
A few things behave the same way across every report:
- Time range - shown top-right, next to a refresh button and an auto-refresh (play) toggle. Every tile, chart, and table on the page reflects this range.
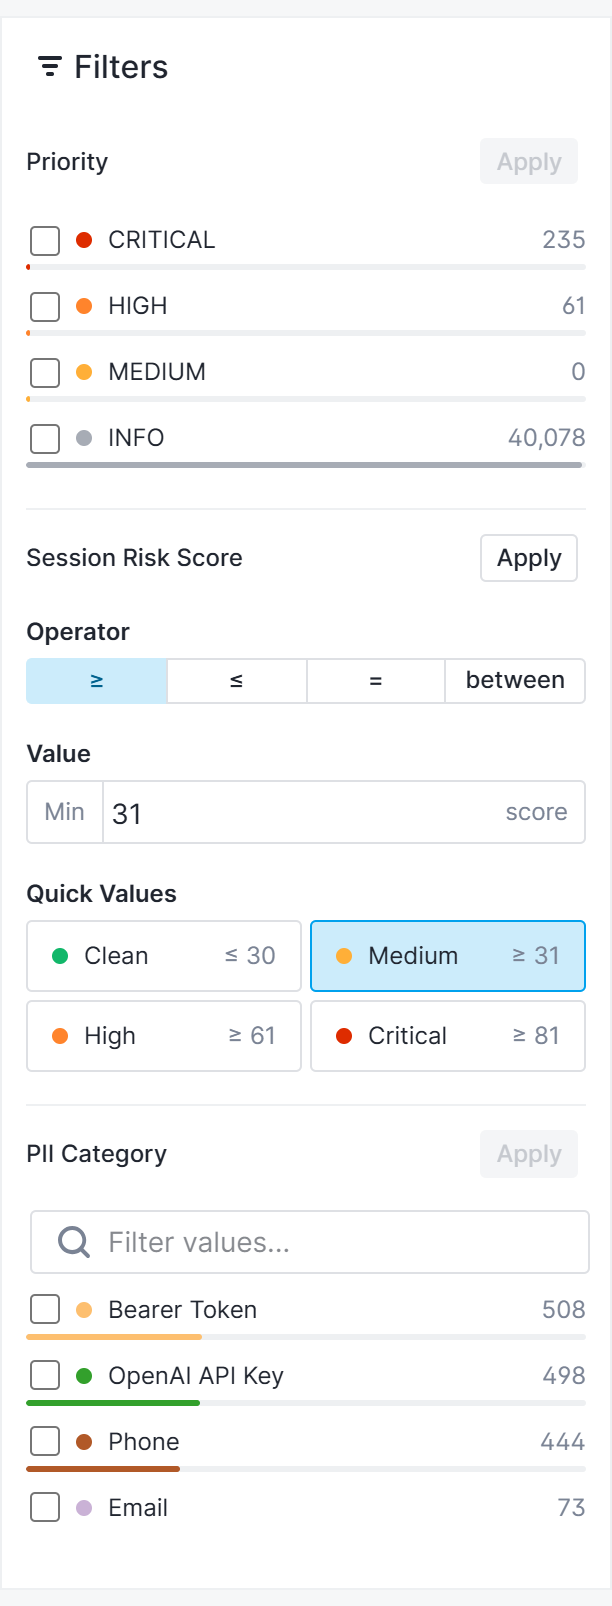
- Filters - click Filters below the breadcrumb to open a filter panel. Available fields depend on the report, but commonly include priority, event type, PII category, and session risk score. Risk score can be filtered with an operator (
=,≥,≤, orbetween) and a value, or with quick presets for the four risk bands - Clean (0-30), Medium (31-60), High (61-80), and Critical (81-100). See Risk Scores & Priorities.
- Outdated agent banner - if any of your host collectors are running an old version, a banner appears warning that they may not be collecting all available data, with a link to see and update the outdated ones.
Context menus and quick actions
Charts provide click to navigate shortcuts into other reports, pre-filtered for whatever you clicked on:
A tile that represents a group (for example Untrusted Agents or Untrusted Hosts) opens a popup listing the top entries in that group - each with its critical event count and, where applicable, quick actions to view that agent's events, mark it as trusted, or see more details.
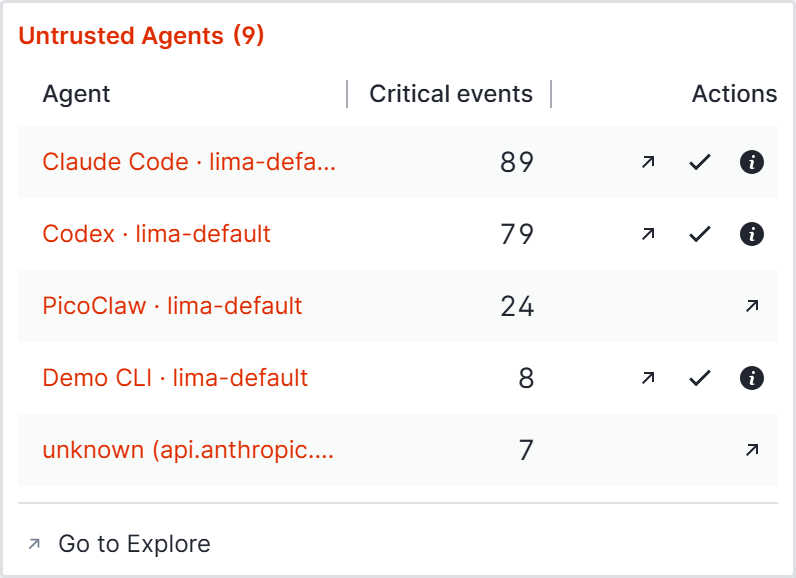
Important detail about that trust status: It reflects the agent's or host's most recent event, not the current setting. Marking one trusted here doesn't retroactively change anything - it still counts as untrusted until its next event comes in, and only from that point on does it stop triggering untrusted-related alerts.
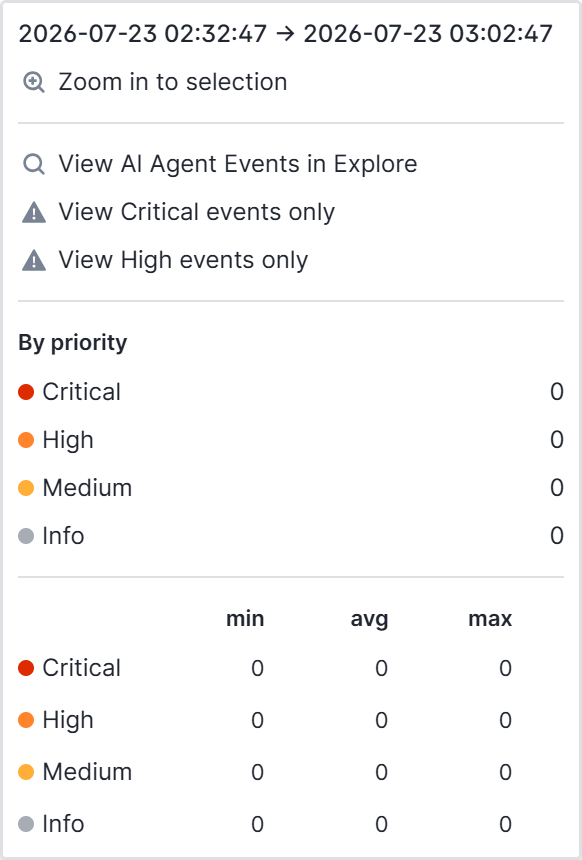
Selecting a range on any timeline chart (click and drag) opens a menu to zoom into that selection, jump to Explore filtered to that time window, or go straight to Critical- or High-only events for it - along with an inline breakdown of event counts by priority for the selection, including min/avg/max.
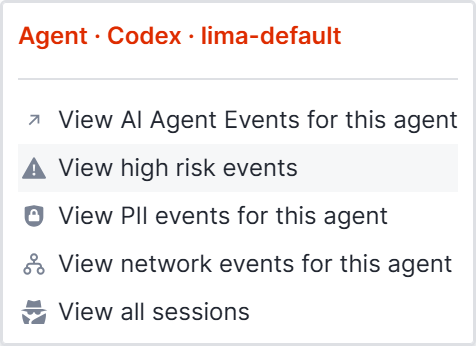
Clicking in a table (for example Top Agents) opens a quick-navigation menu to that agent's events in Explore, its high-risk events, its PII events, its network events, or all of its sessions.
Overview
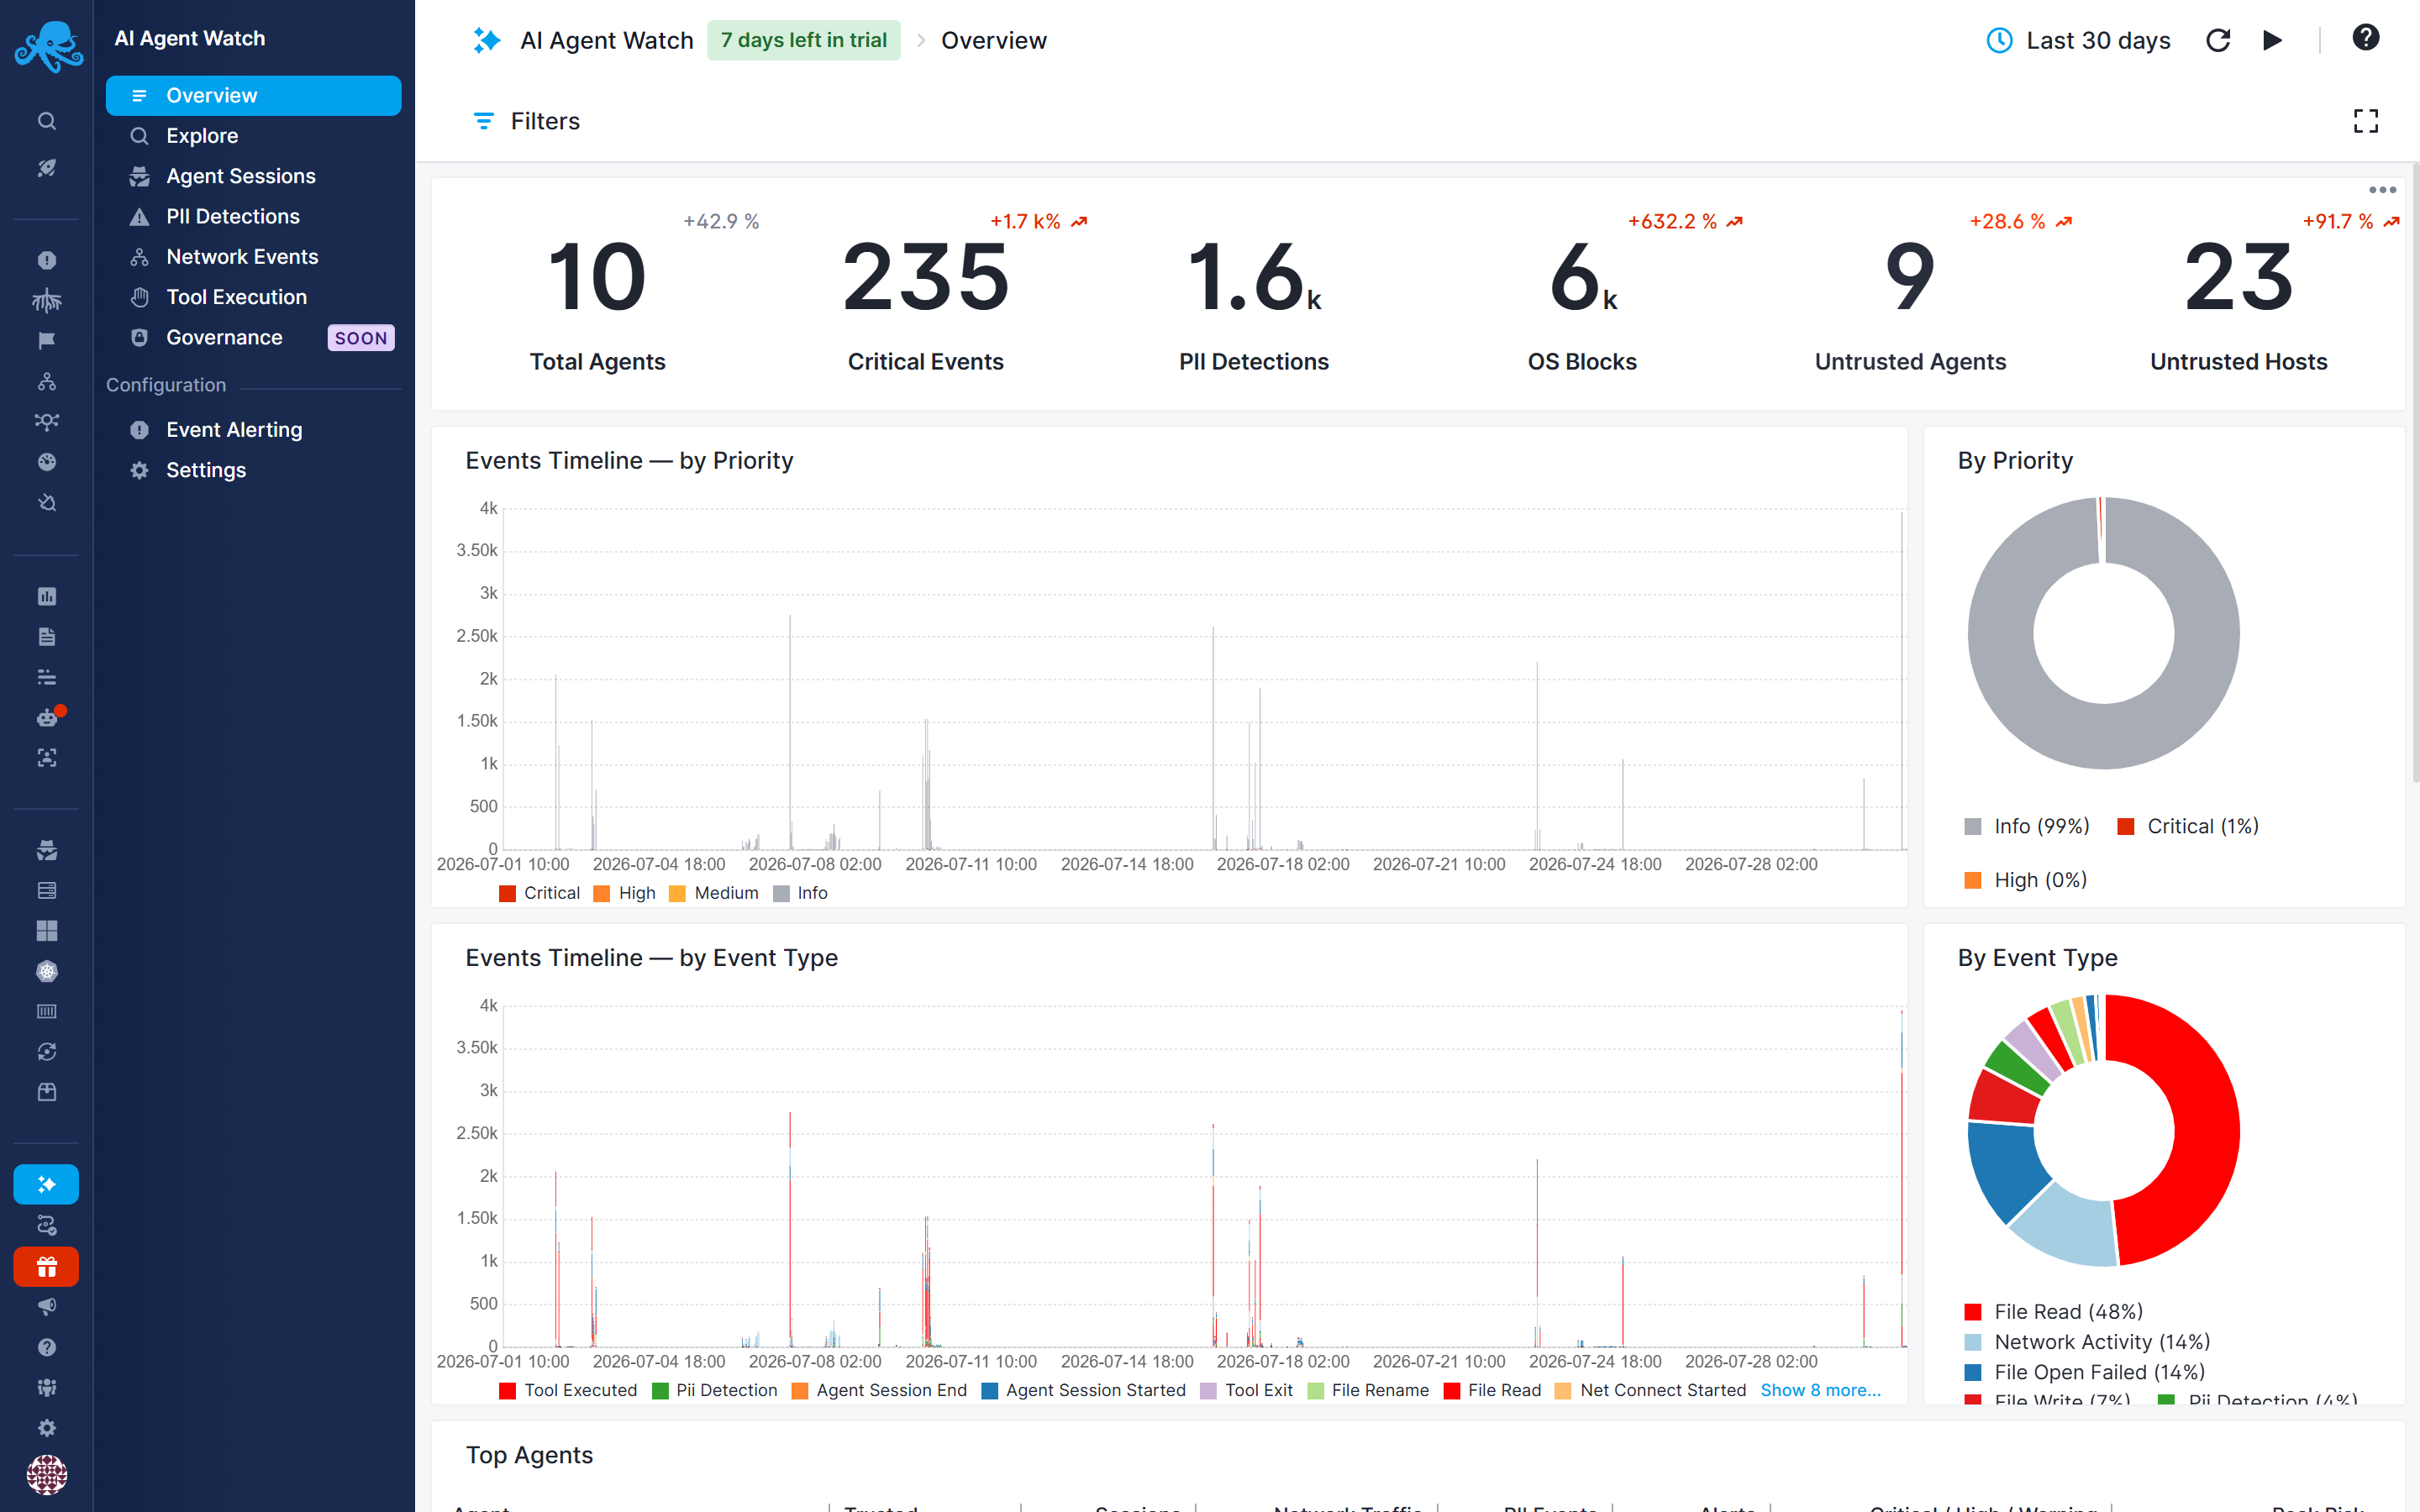
The account-wide summary: how many agents you have, how much risky activity showed up, and where to look next.
- Tiles: Total Agents, Critical Events, PII Detections, OS Blocks (the
exec_failed/file_open_failedevents where the kernel denied an agent's action), Untrusted Agents, and Untrusted Hosts, each with the percentage change versus the previous period. - Events Timeline - by Priority, with a matching doughnut breakdown.
- Events Timeline - by Event Type, with a matching doughnut breakdown.
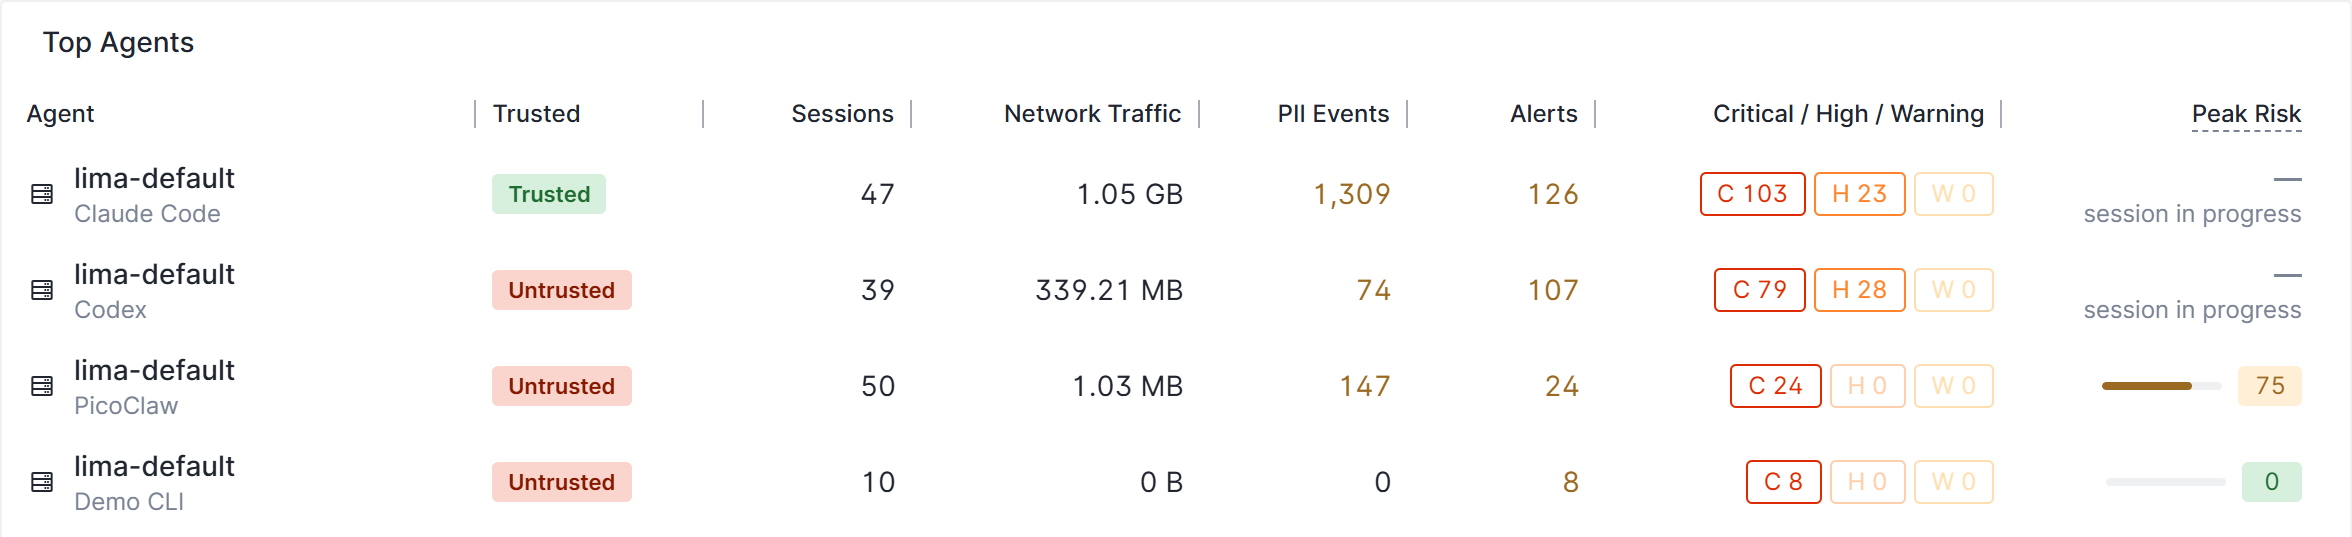
- Top Agents table - per-agent rollup of trust status, sessions, network traffic, PII events, alerts, and Critical/High/Warning counts, plus a peak risk indicator (shown as "session in progress" while an agent has an active session).
Explore
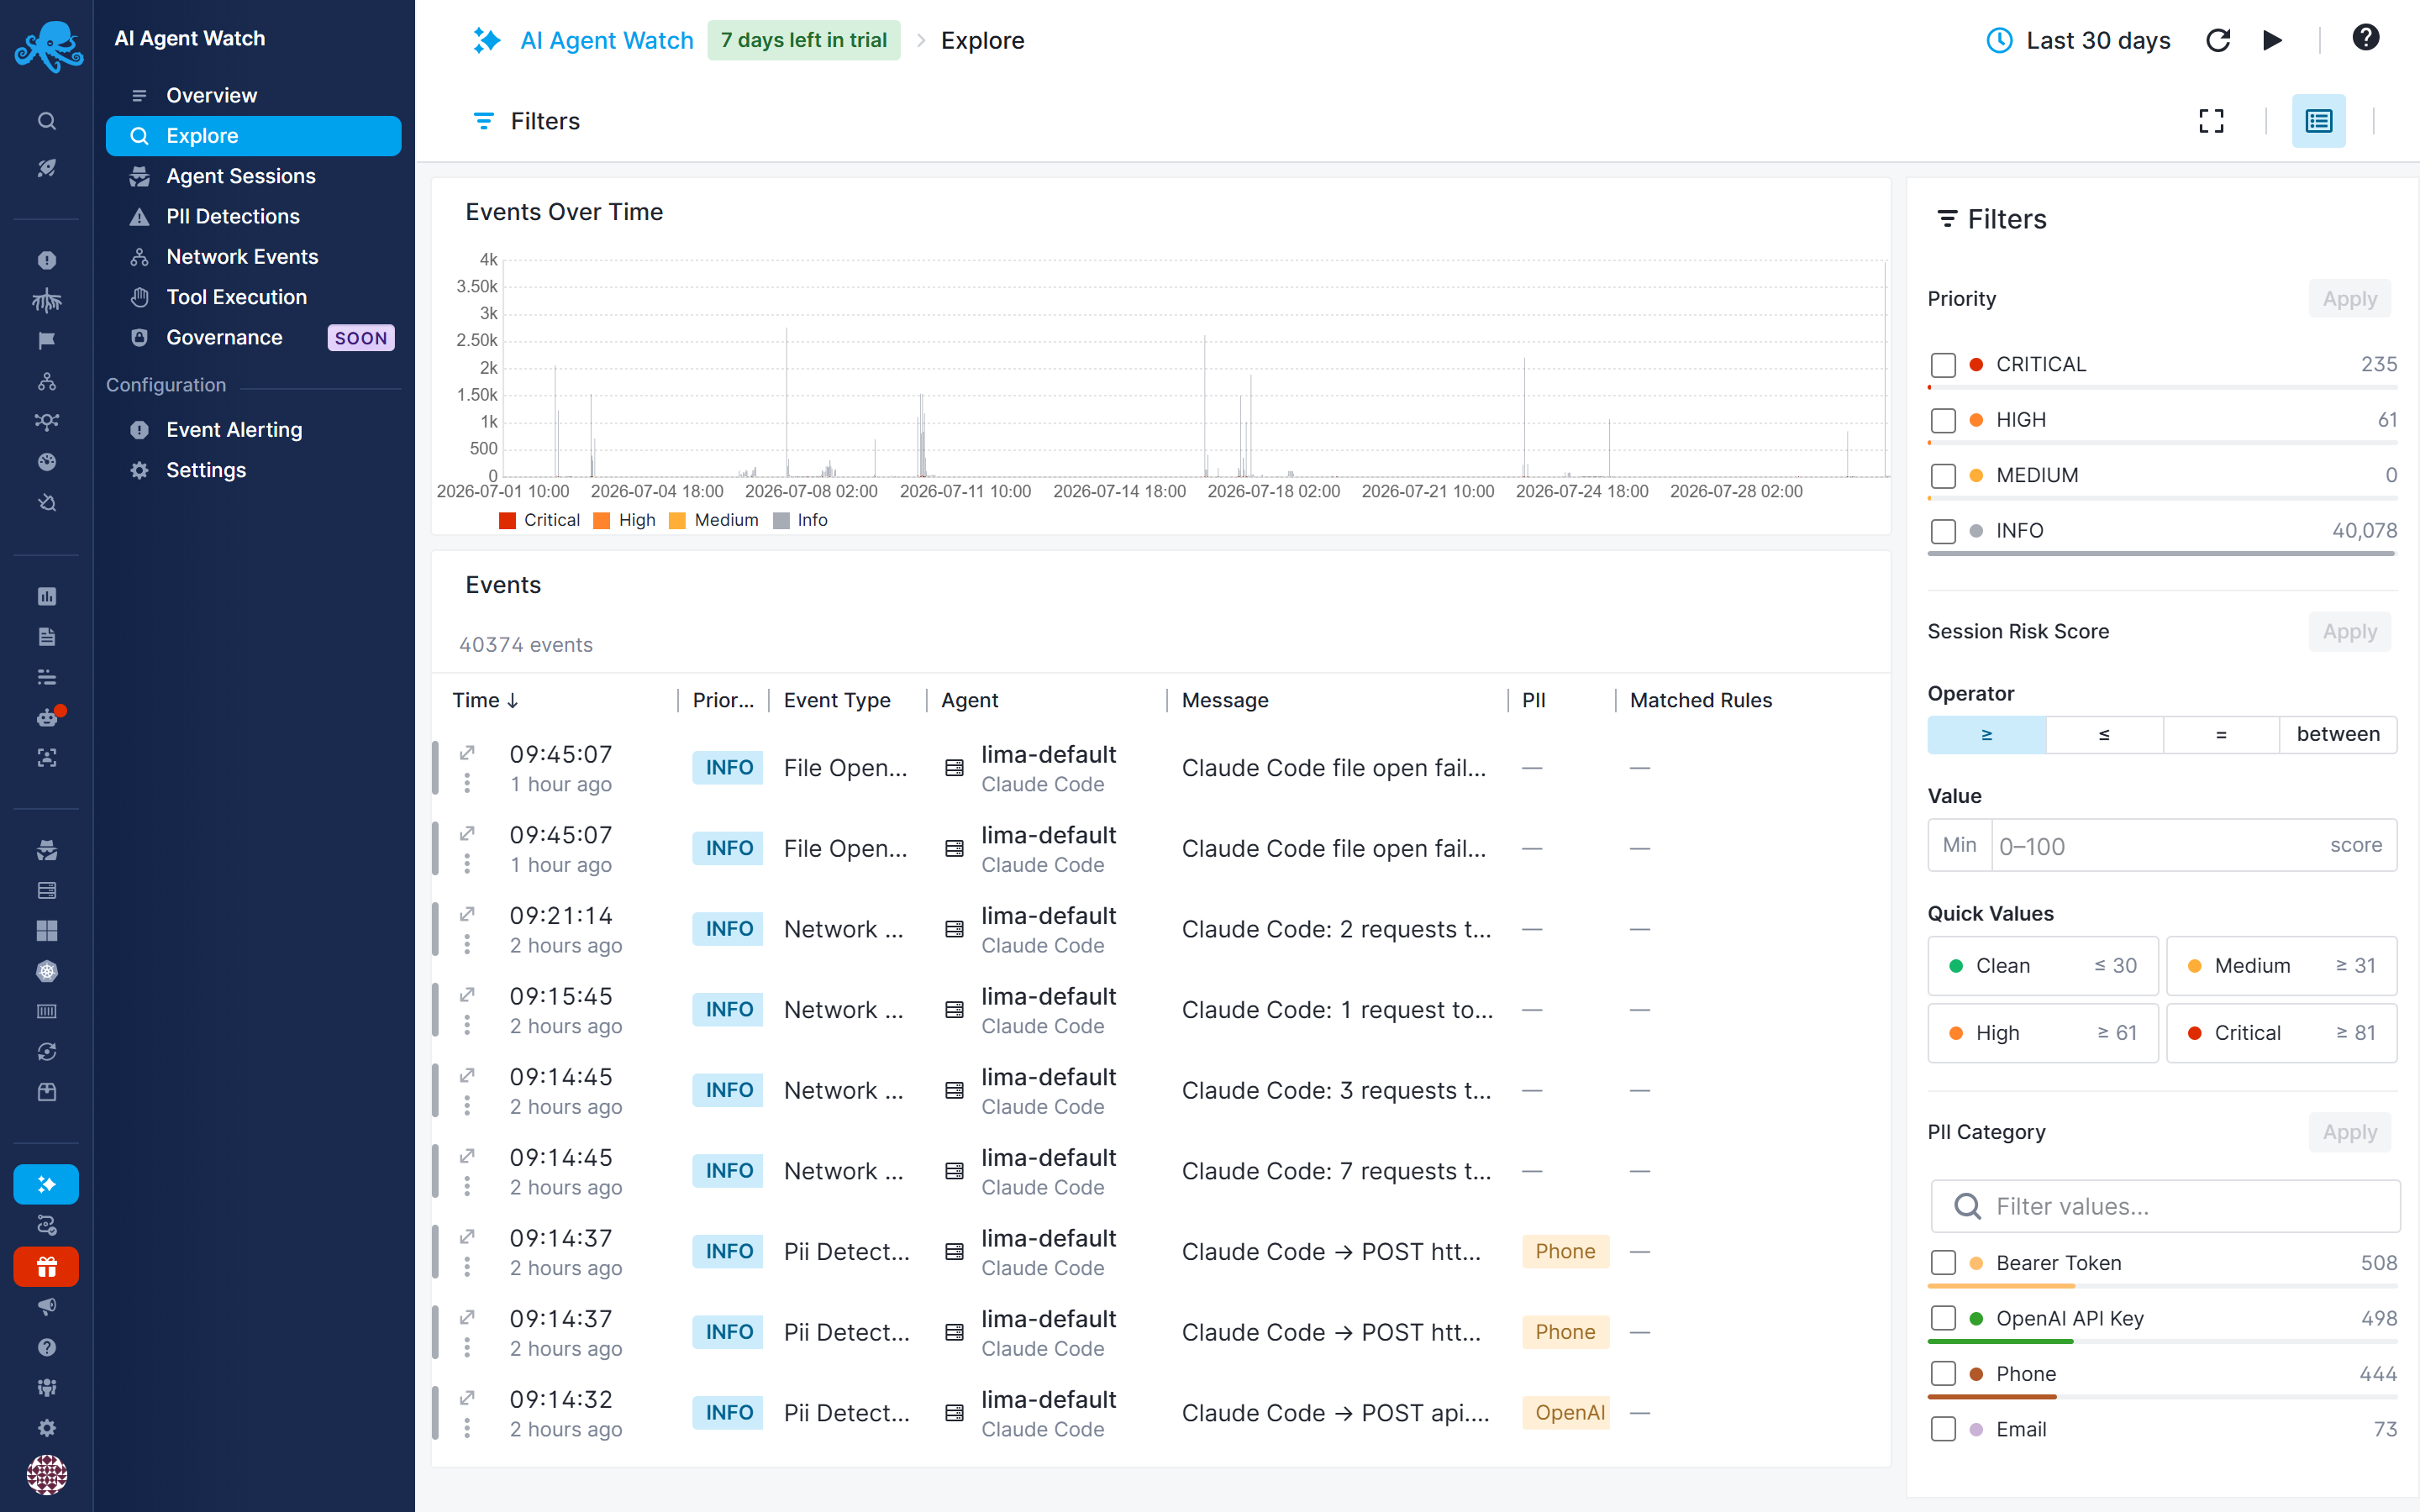
A general-purpose events browser - the place to start when you're looking for something specific rather than a summary.
- An events-over-time chart, colored by priority.
- A full events table: time, priority, event type, agent, message, PII category (if any), and matched rules.
- The Filters panel here has the most detail, covering priority, session risk score, PII category, and event type all at once.
See Captured Events for what each event type and field means.
Agent Sessions
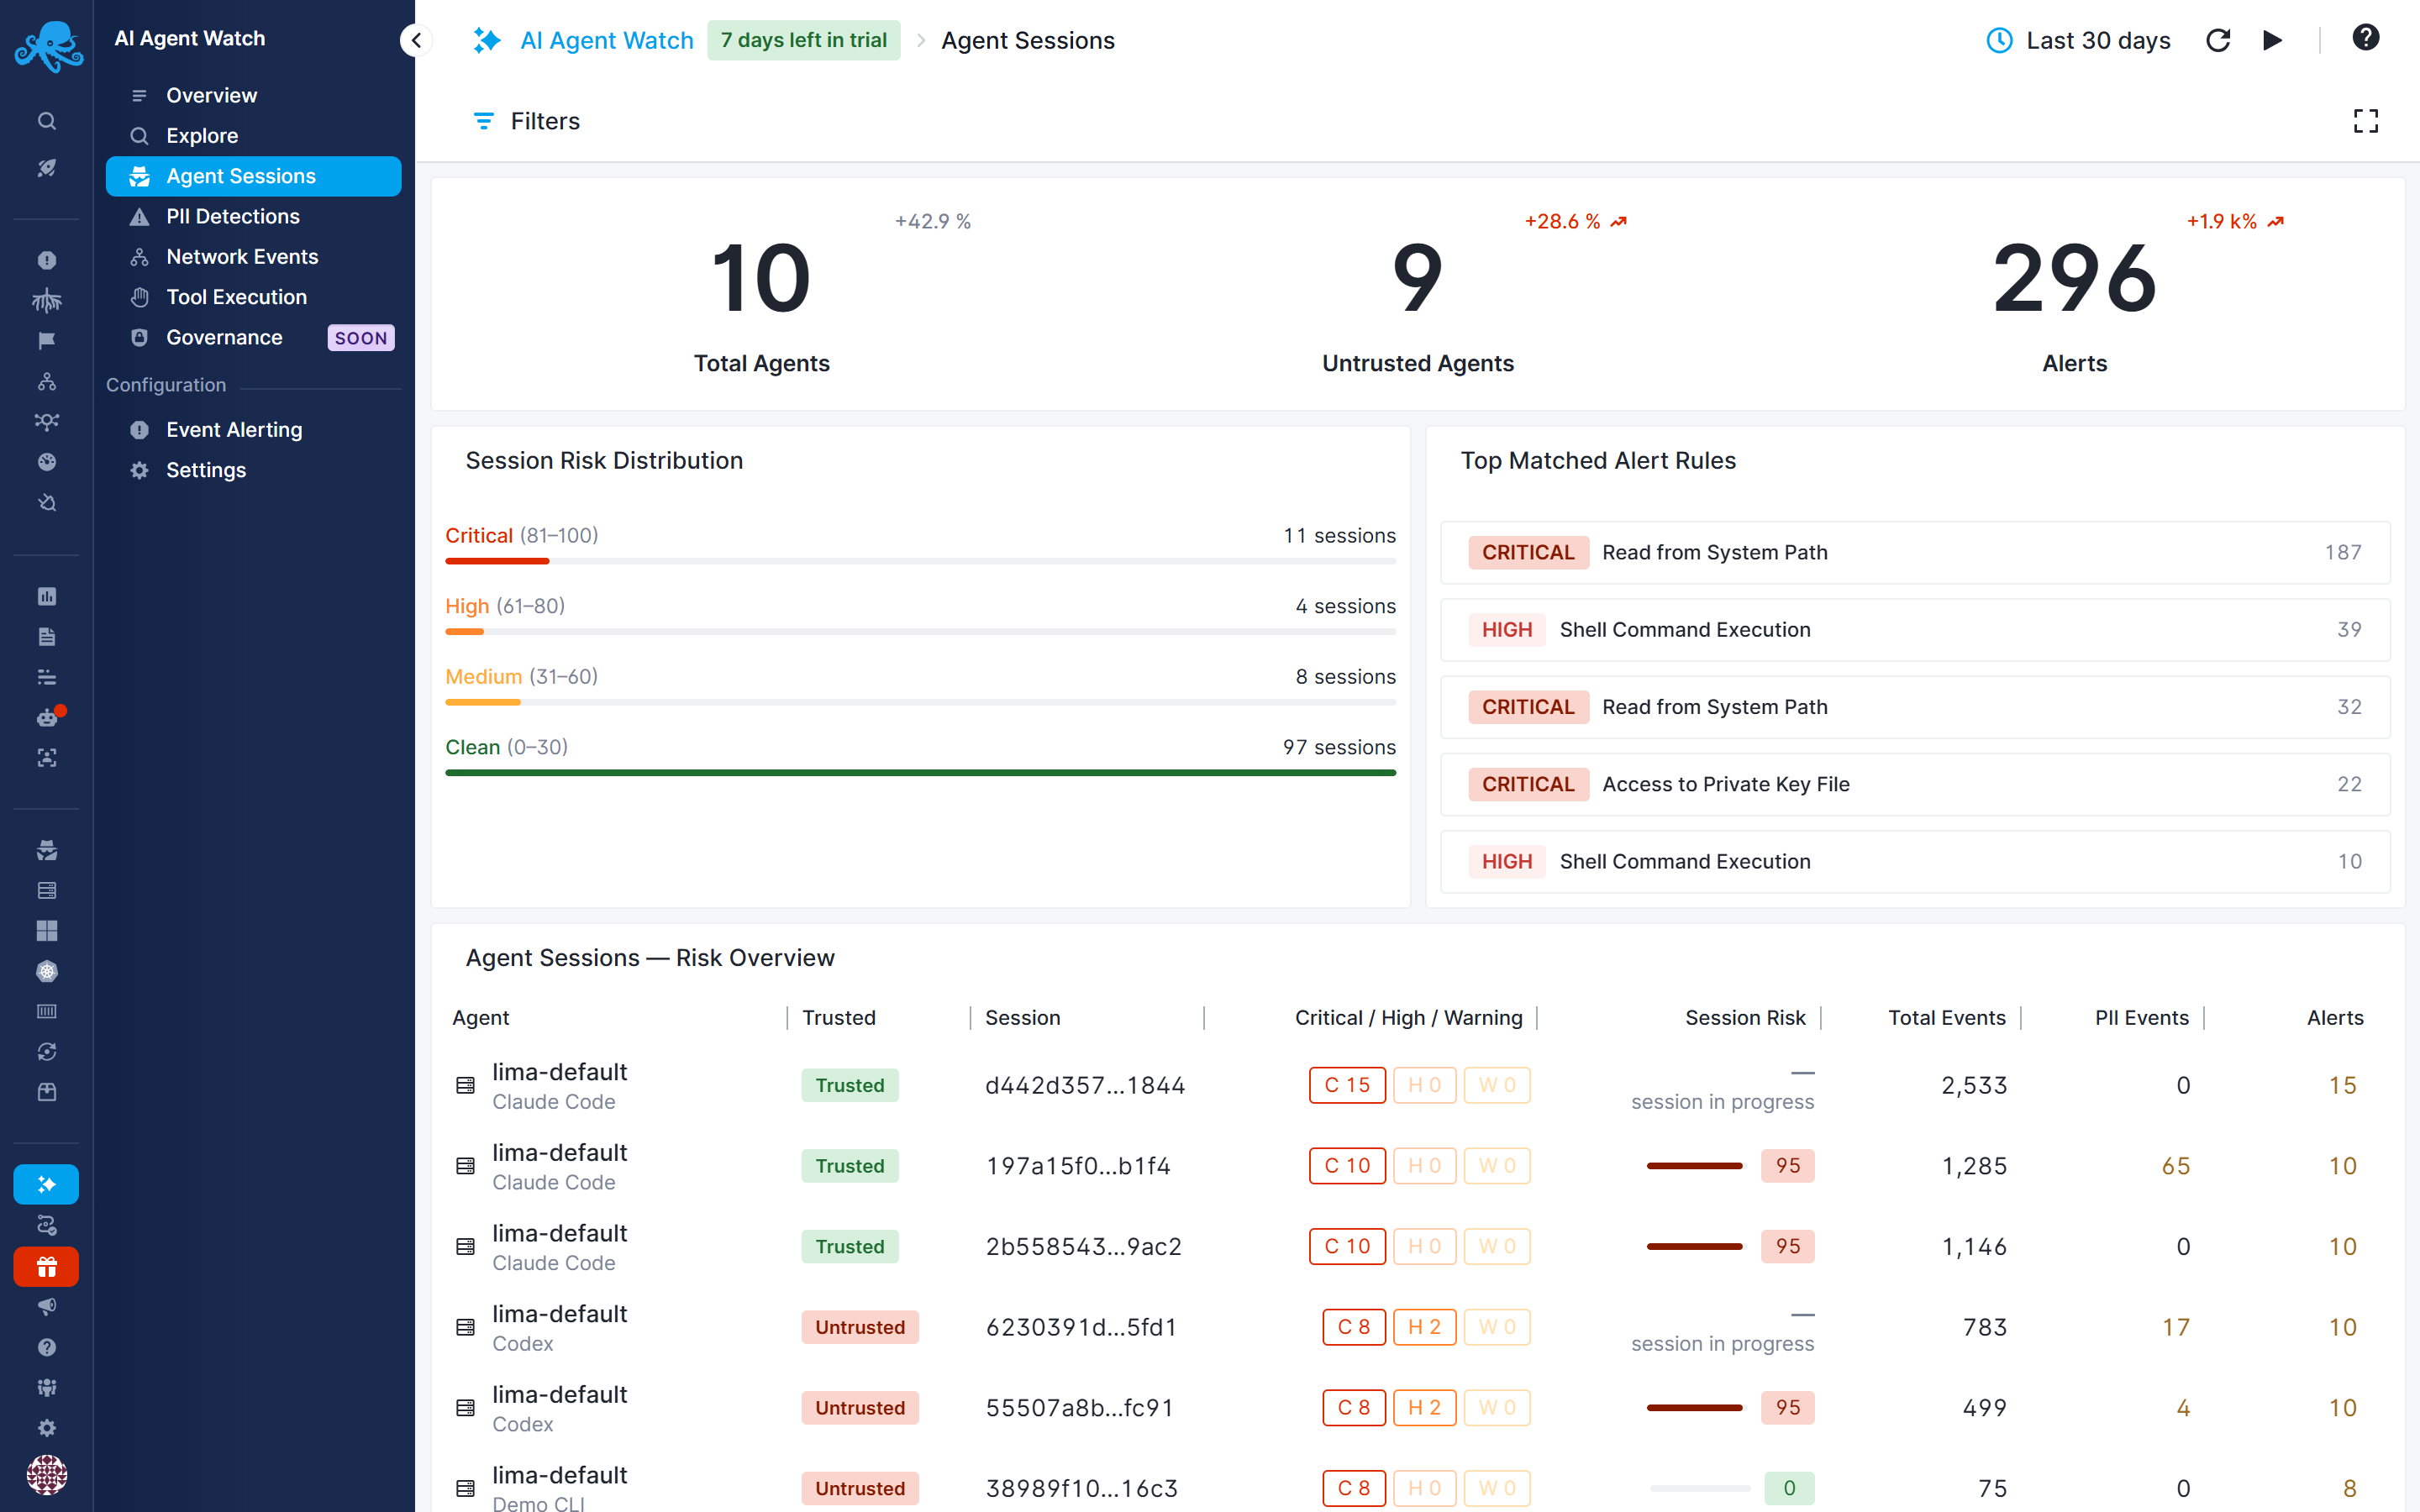
A session-centric view - useful for judging whole sessions rather than individual events.
- Tiles: Total Agents, Untrusted Agents, Alerts.
- Session Risk Distribution - how many sessions fall into each risk band (Clean, Medium, High, Critical). See Risk Scores & Priorities.
- Top Matched Alert Rules - which alert rules fired most often across sessions, with their priority and match count.
- Agent Sessions - Risk Overview table - one row per session: trust status, Critical/High/Warning counts, session risk score (or "session in progress" if the session hasn't ended yet), total events, PII events, and alerts.
PII Detections
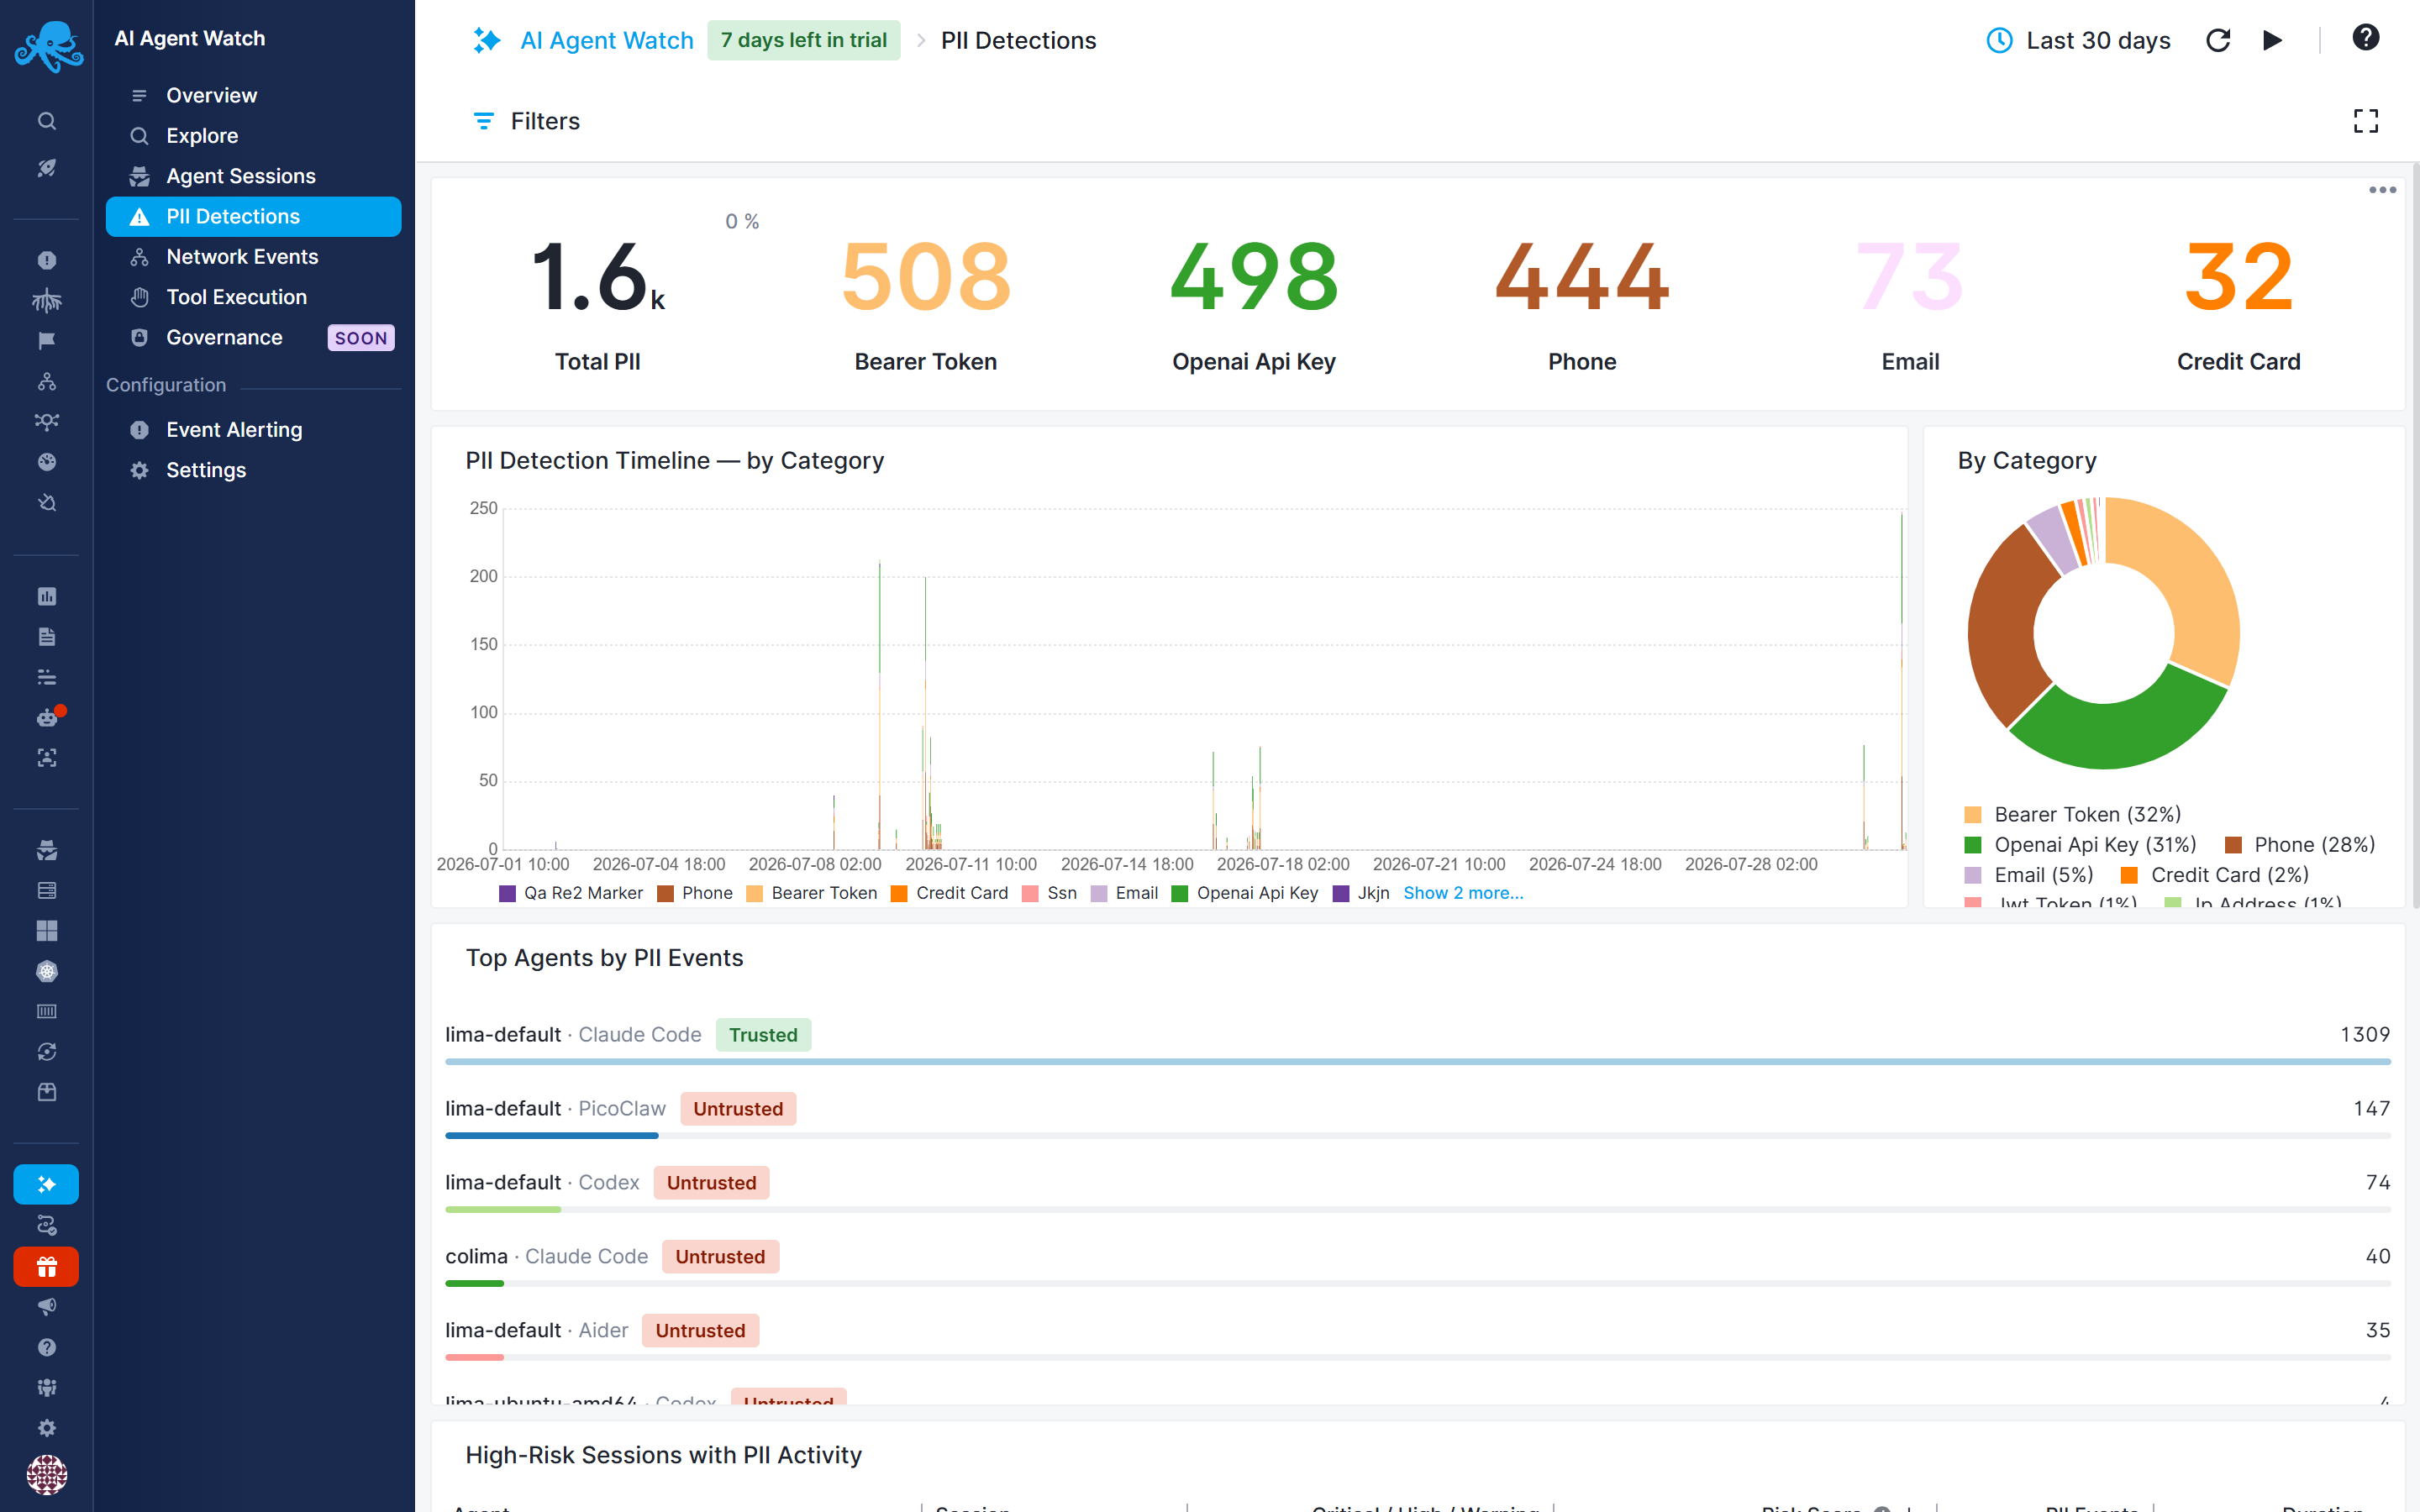
A closer look at everything caught by your PII categories.
- Tiles: Total PII, plus one tile per top category (for example Bearer Token, OpenAI API Key, Phone).
- PII Detection Timeline - by Category, with a matching doughnut breakdown - custom categories you've added show up here alongside the defaults.
- Top Agents by PII Events.
- High-Risk Sessions with PII Activity table, sorted by session risk score, showing PII event counts and duration per session.
Network Events
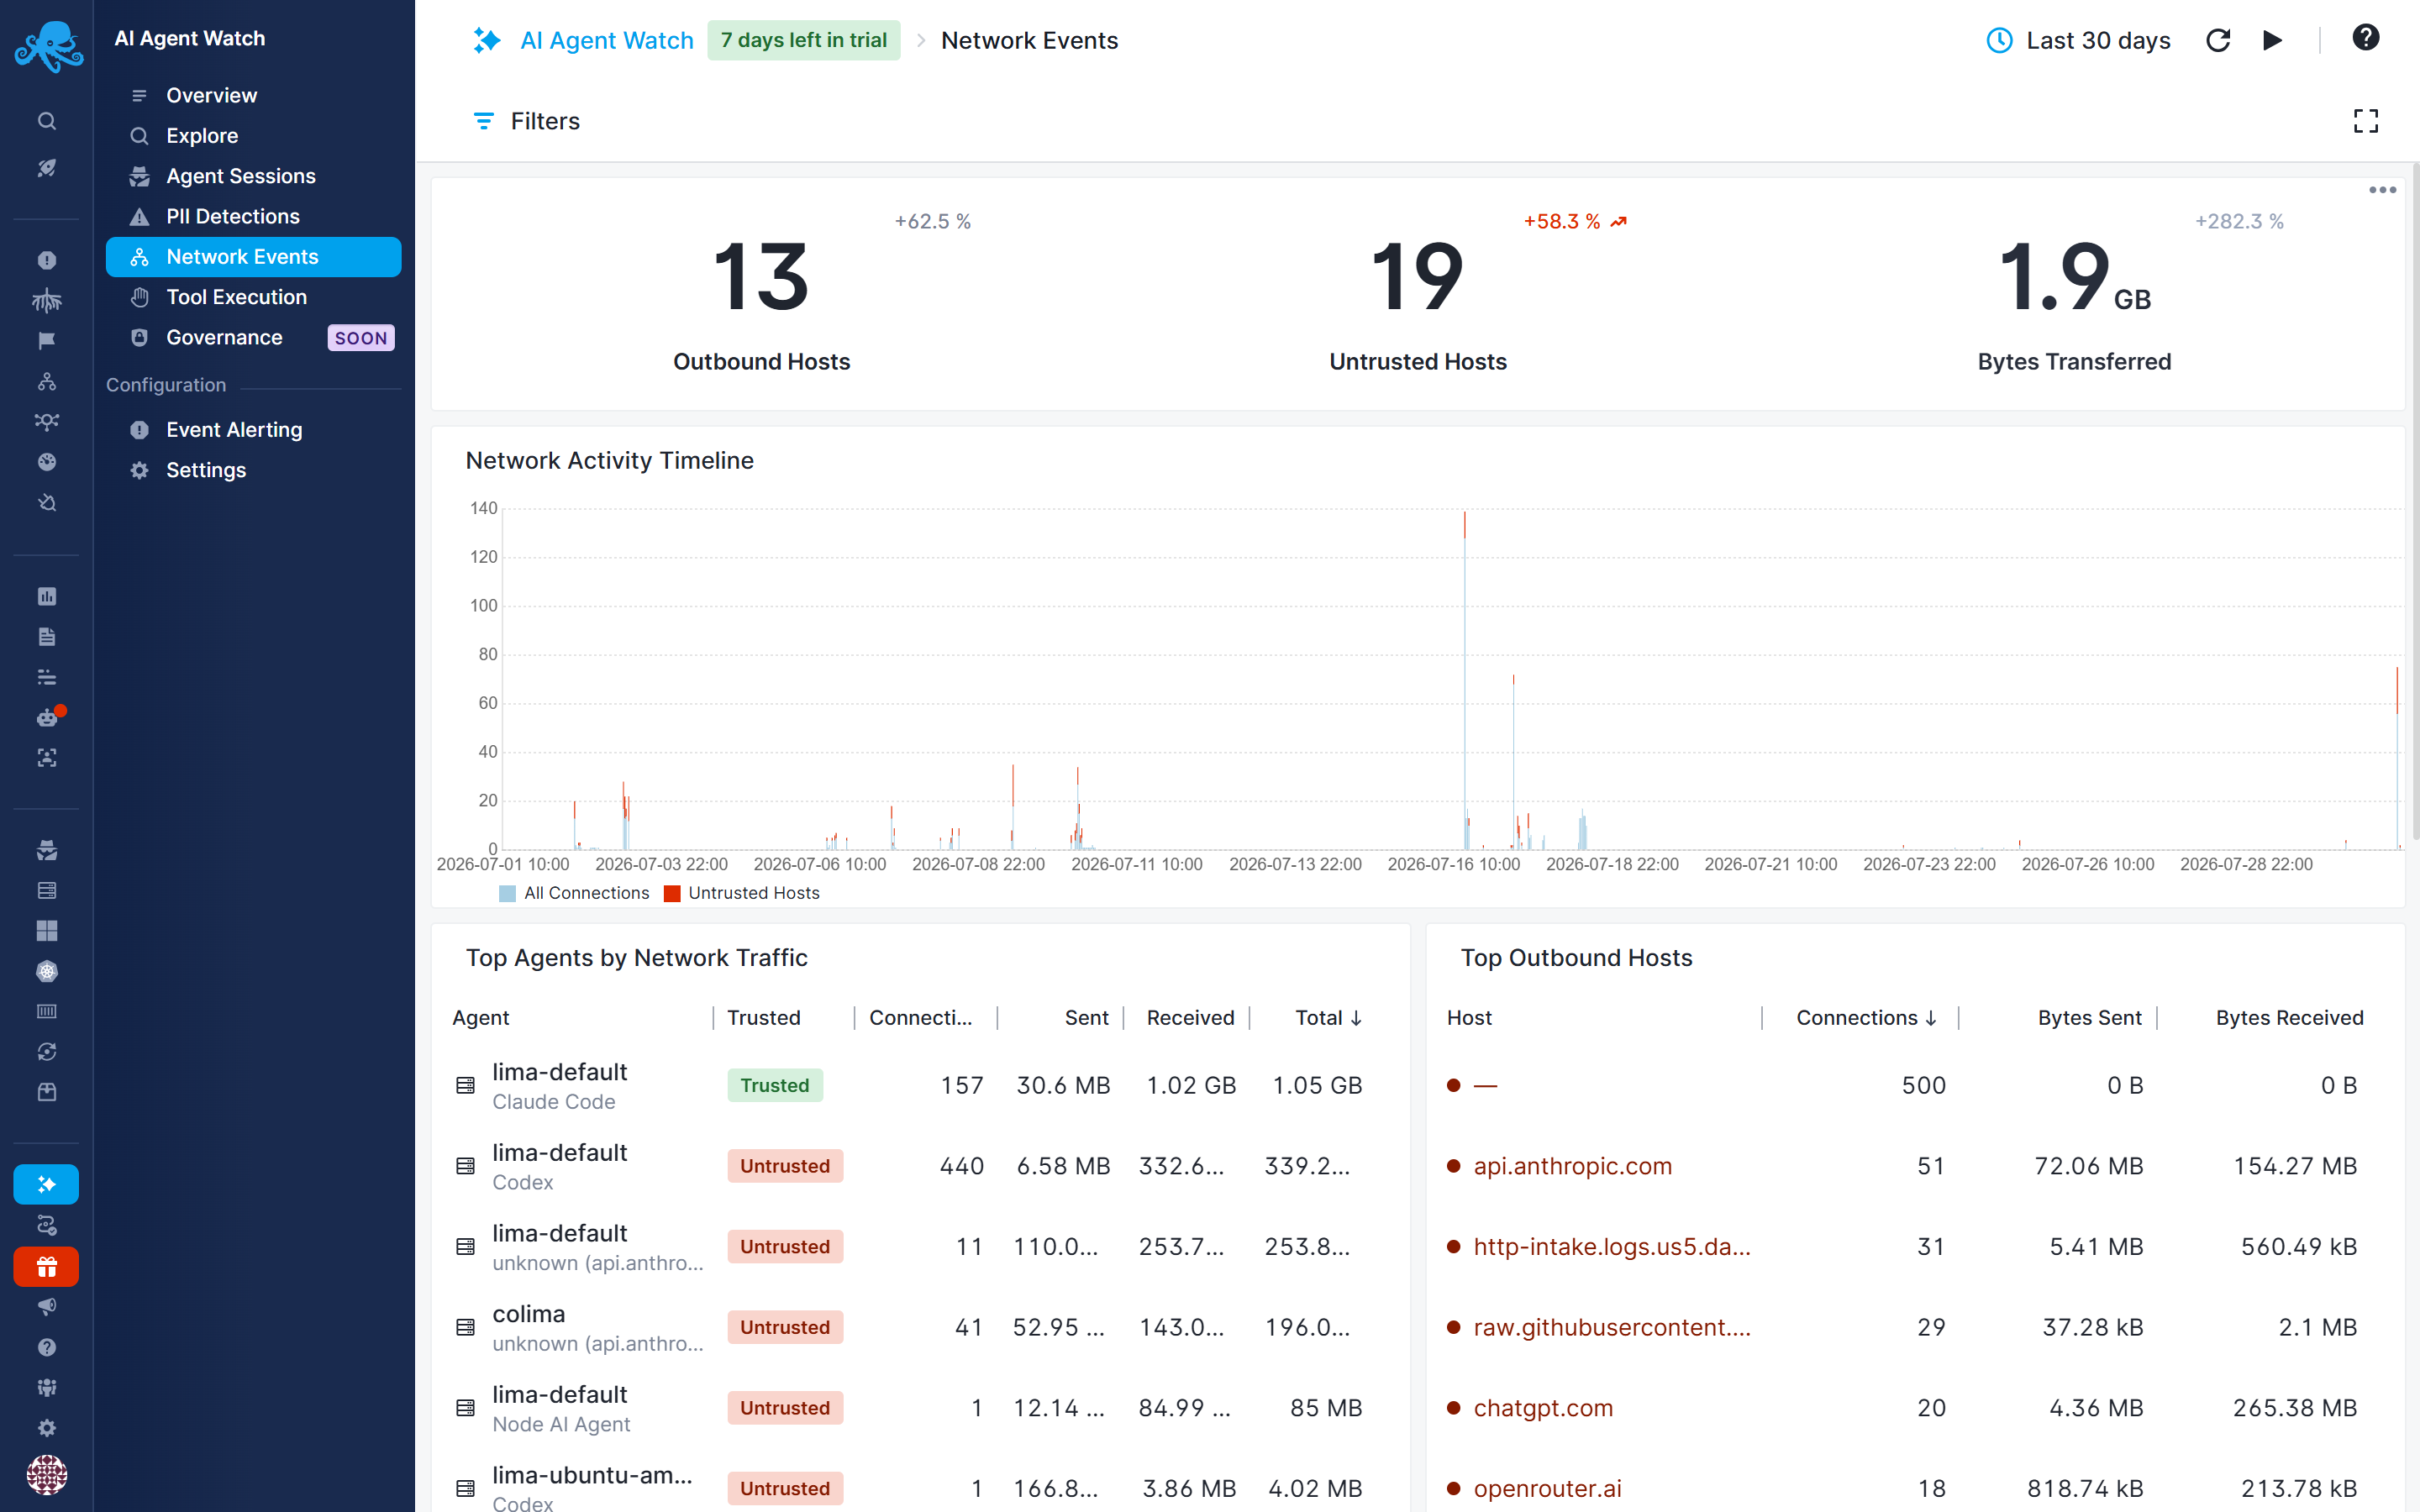
Outbound connectivity from detected agents, with a focus on what's trusted and what isn't.
- Tiles: Outbound Hosts, Untrusted Hosts, Bytes Transferred.
- Network Activity Timeline, toggleable between all connections and untrusted-only.
- Top Agents by Network Traffic table.
- Top Outbound Hosts table.
- Untrusted Host Connections table - a raw list of connections to destinations not on your trusted host list, which doubles as a shortlist of candidates to review and potentially add in Trusted Agents & Hosts.
Tool Execution
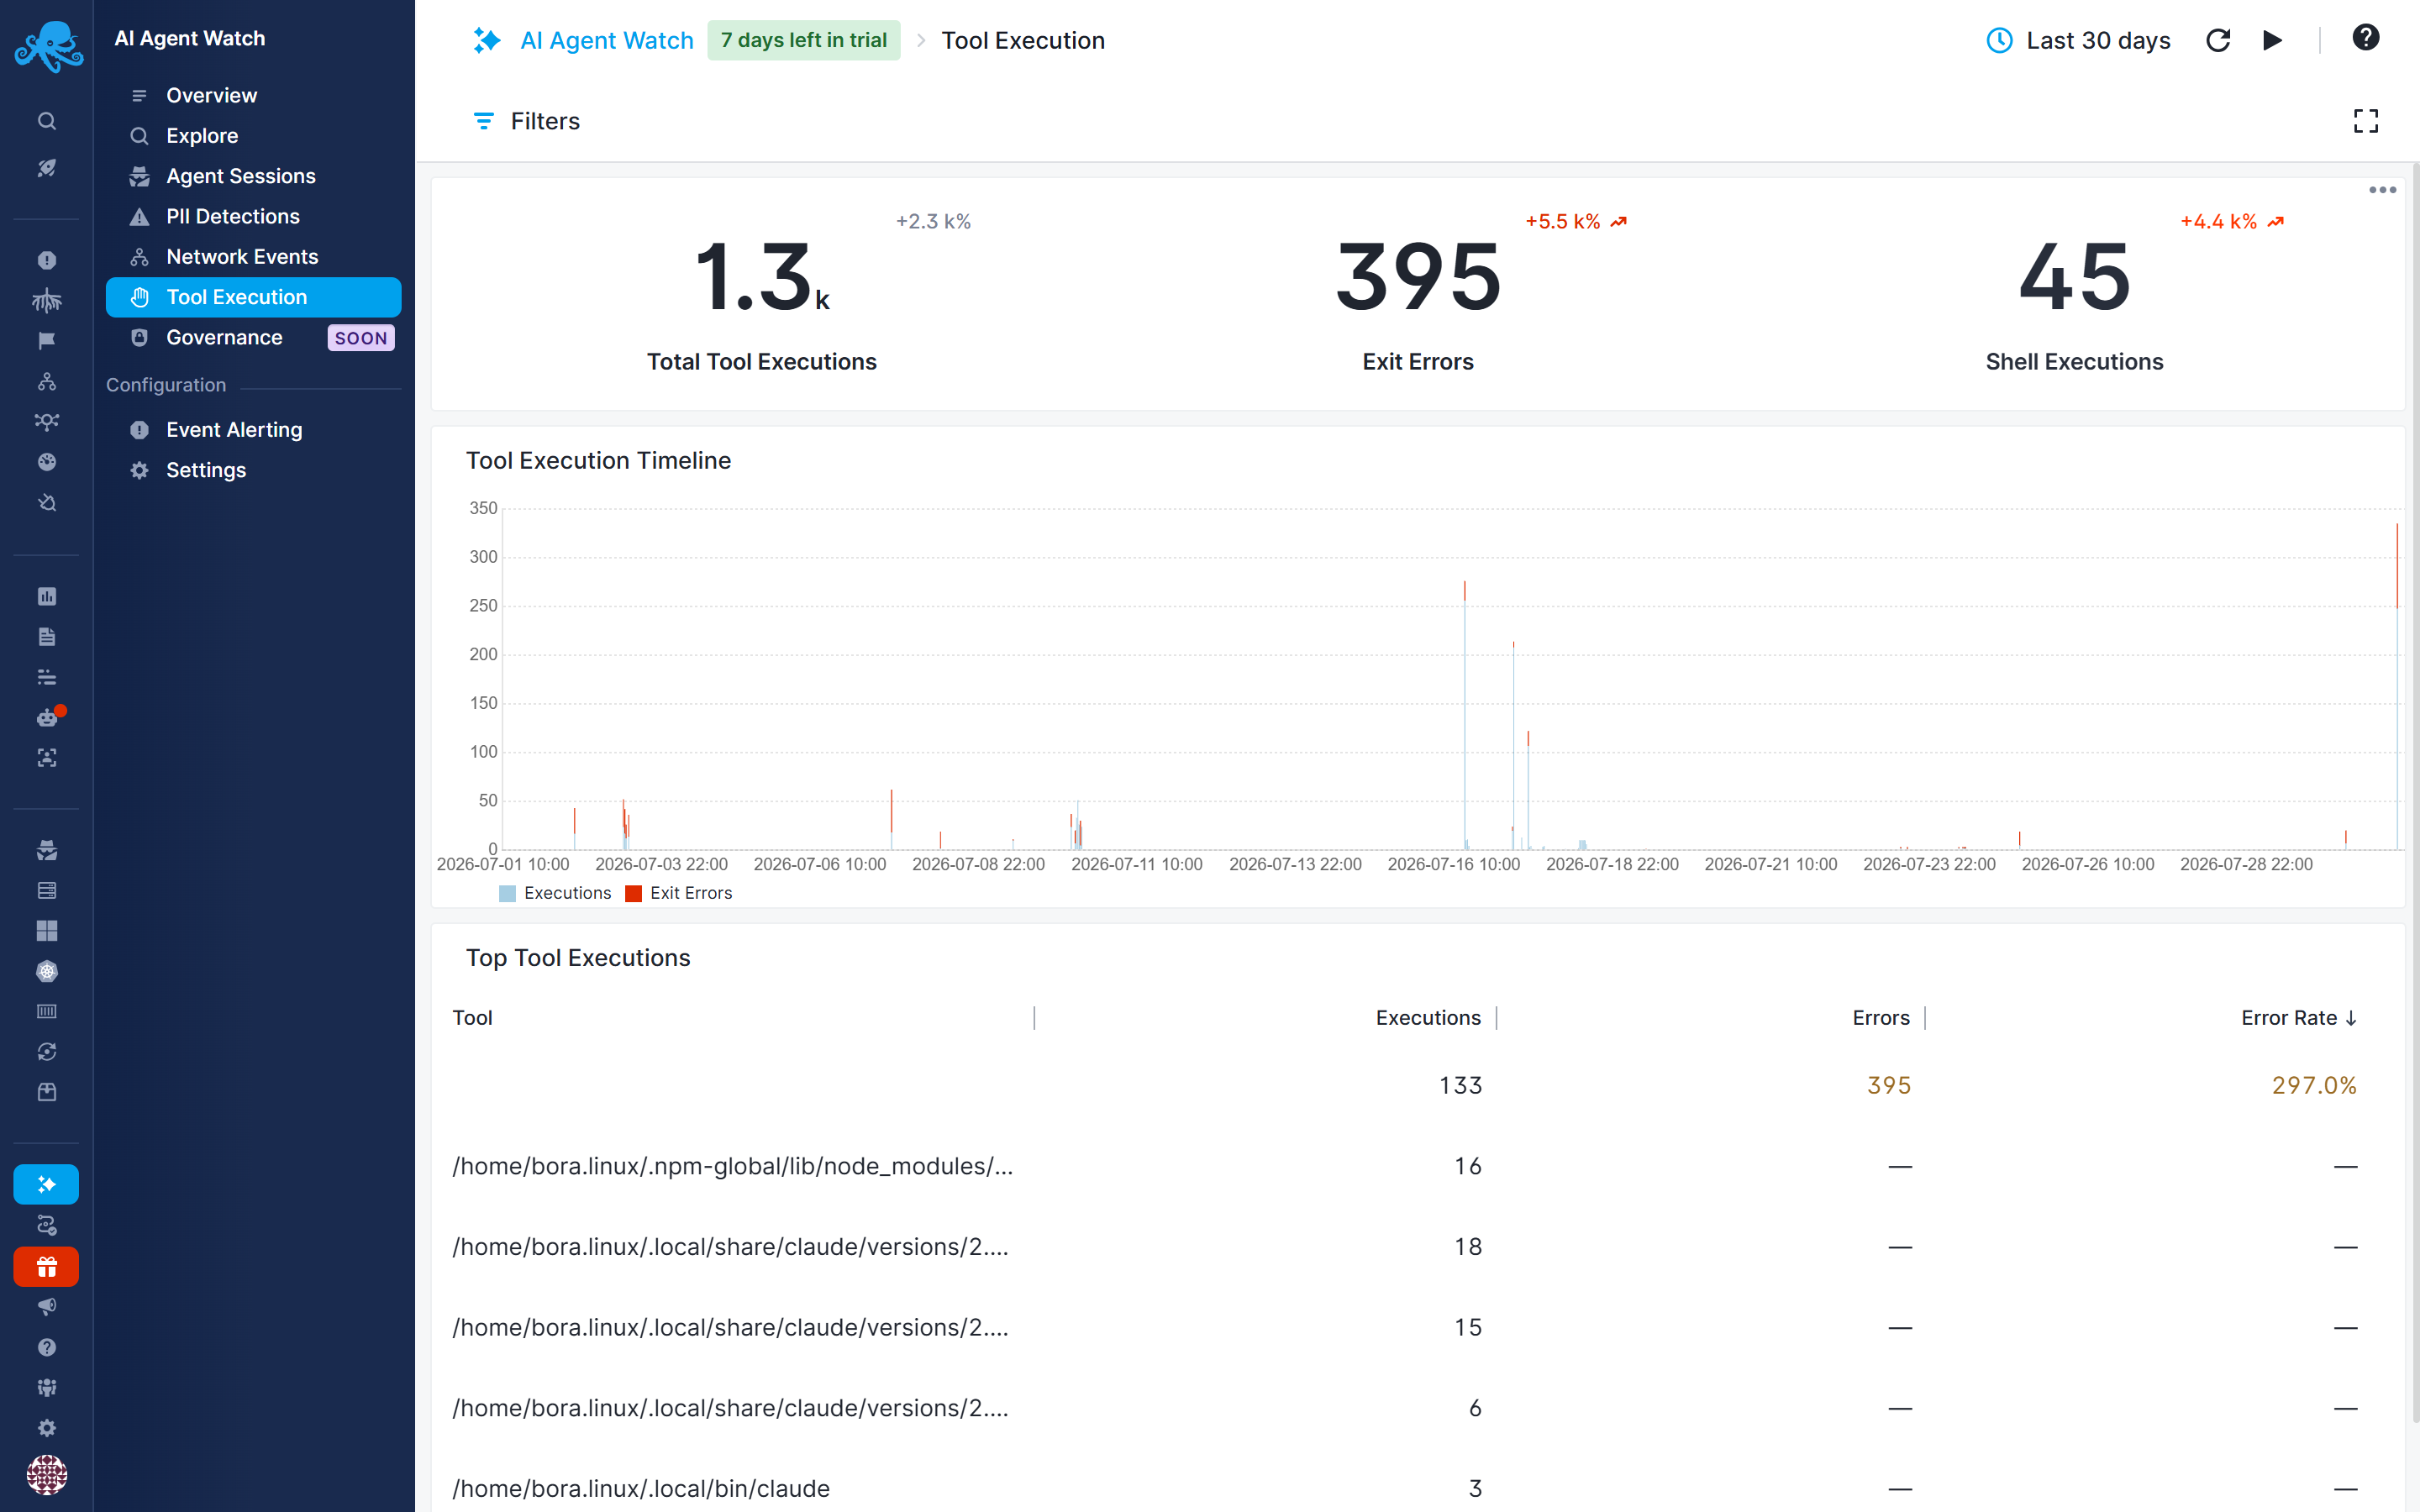
Shell commands and other subprocesses detected agents have spawned.
- Tiles: Total Tool Executions, Exit Errors, Shell Executions.
- Tool Execution Timeline, plotting executions against exit errors.
- Top Tool Executions table - tool path, execution count, error count, and error rate, sorted to surface the tools failing most often.
Governance
Enforcement activity from enabled governance policies.
- Tiles: Enforcement counts and Hosts Ready. Click Hosts Ready to open Settings → Governance Compatibility.
- A timeline of governance events by event type.
- An events table for
exec_denied,file_access_denied, andnet_denied, with enforcement context and priority and event-type filtering.
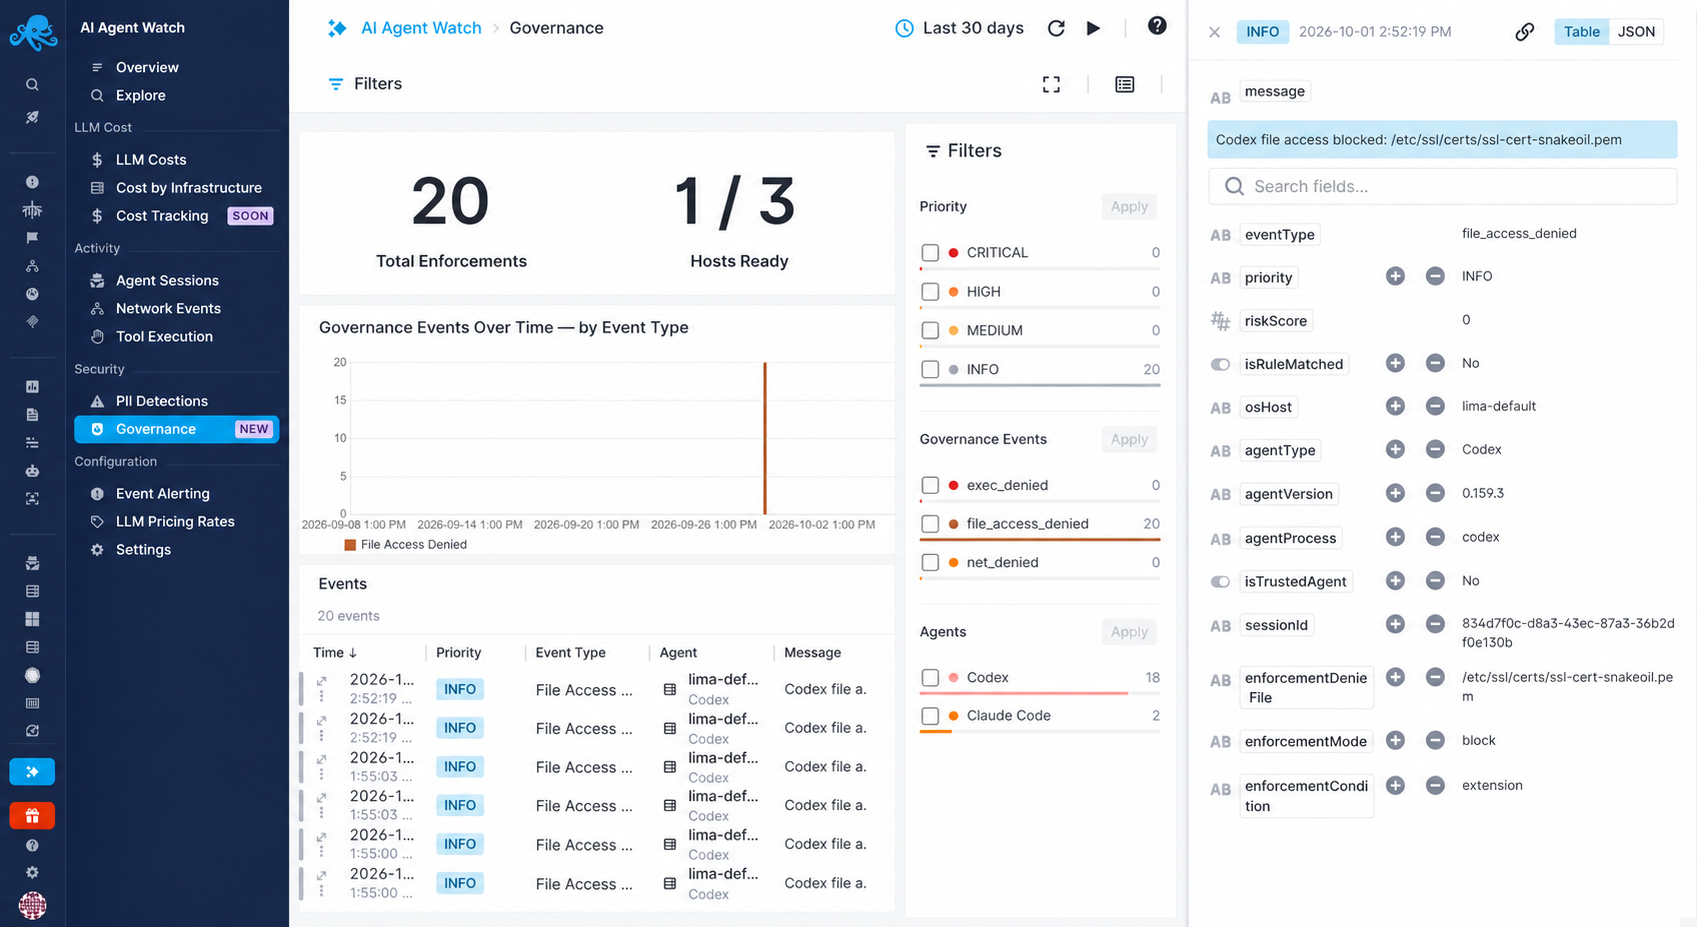
Sematext Agent reports blocked operations as governance events. See Governance Policies for policy configuration and alerting, and Governance Compatibility for host requirements.