SLOs
For each synthetic monitor you can define one of more Service Level Objectives (SLO).
Service Level Indicators and Error Budget
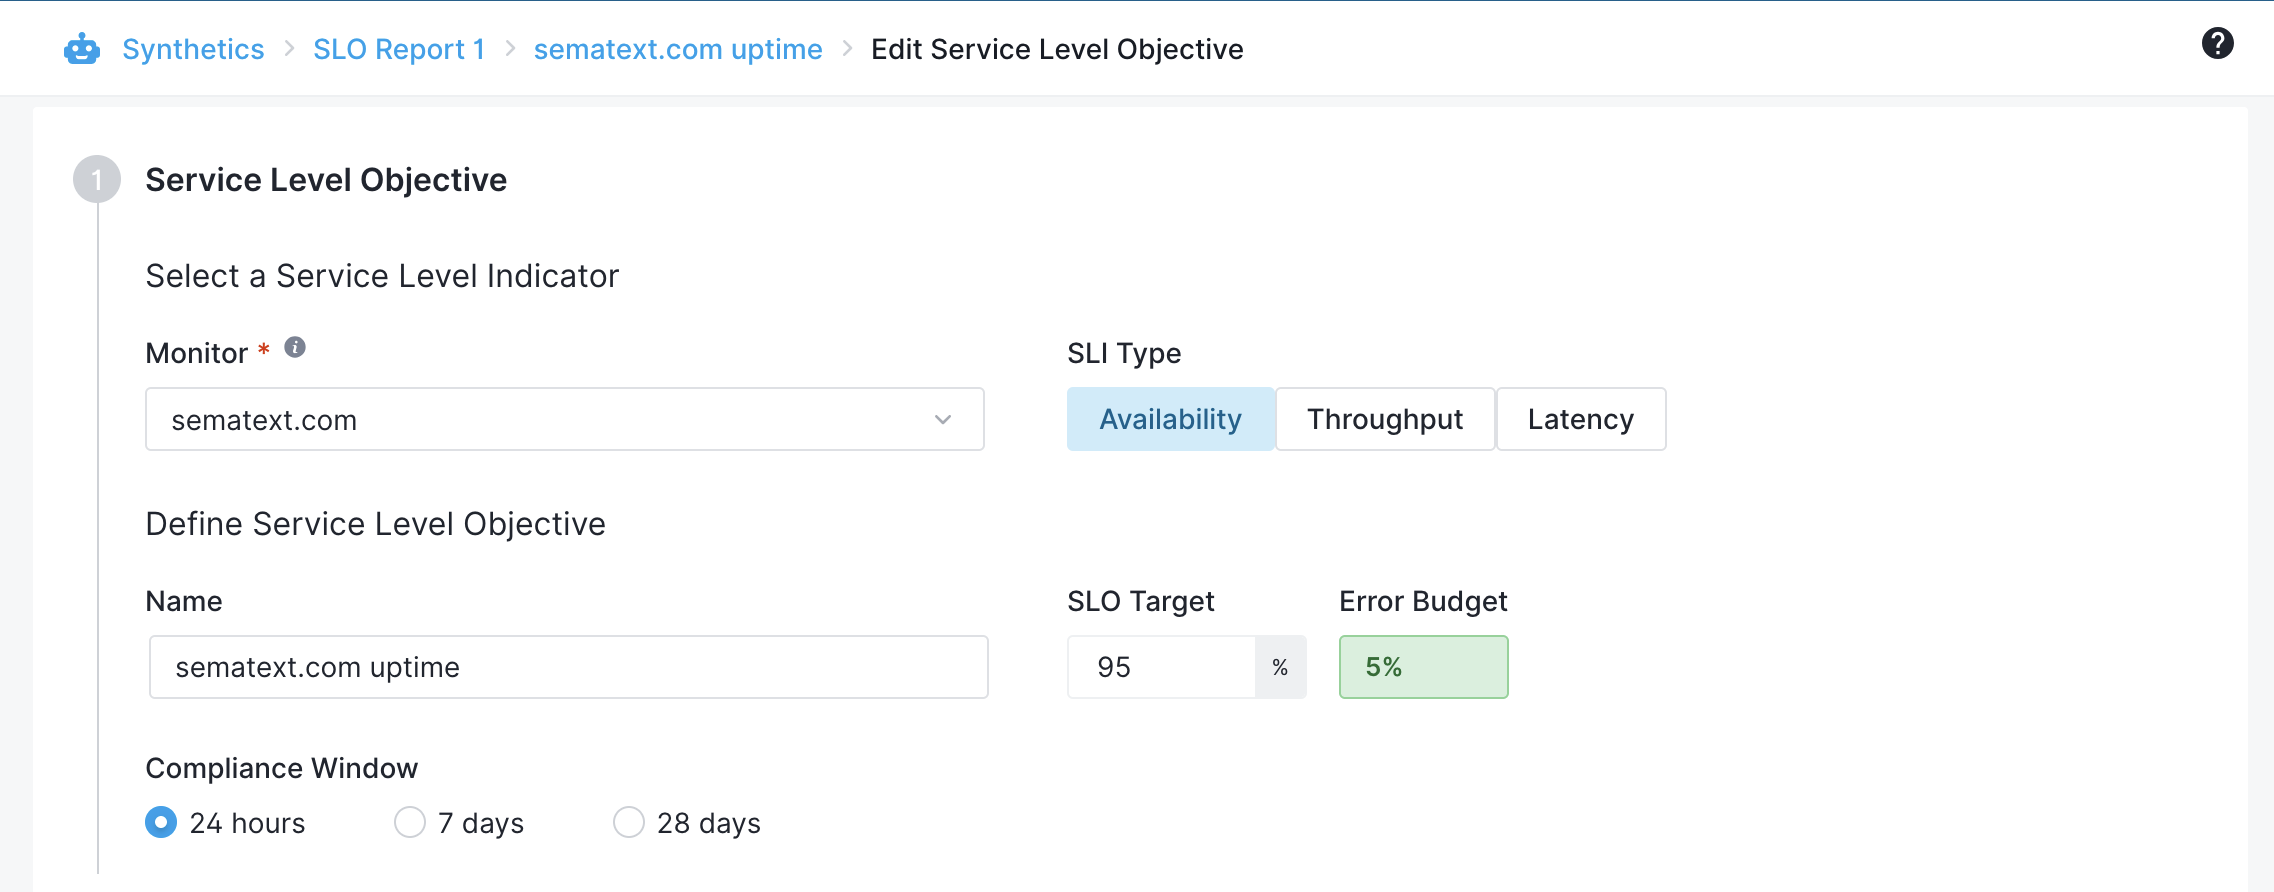
Each SLO is based on one of the following Service Level Indicators (SLI) types:
- Availability
- Throughput
- Latency
Each SLO’s Error Budget is computed based on the SLO Target that you specify.
What is Error Budget?
Generally speaking, an SLO Error Budget is the total amount of allowed downtime or failed synthetic runs during a set time period - the Compliance Window in the above screenshot. It helps teams balance speed and system stability and alerts them when the monitor services' availability, throughput, or latency don't meet the SLO Target.
Key Ideas:
- Goal: Set a limit for acceptable failures.
- Math: 100% minus your target uptime percentage (note the screenshot above)
- Rule: If the budget is gone, stop new feature updates and fix reliability issues.
You may create multiple, separate SLOs for the same synthetic monitor. For example, you can create an SLO based on Availability as well as Latency.
SLO Alerts
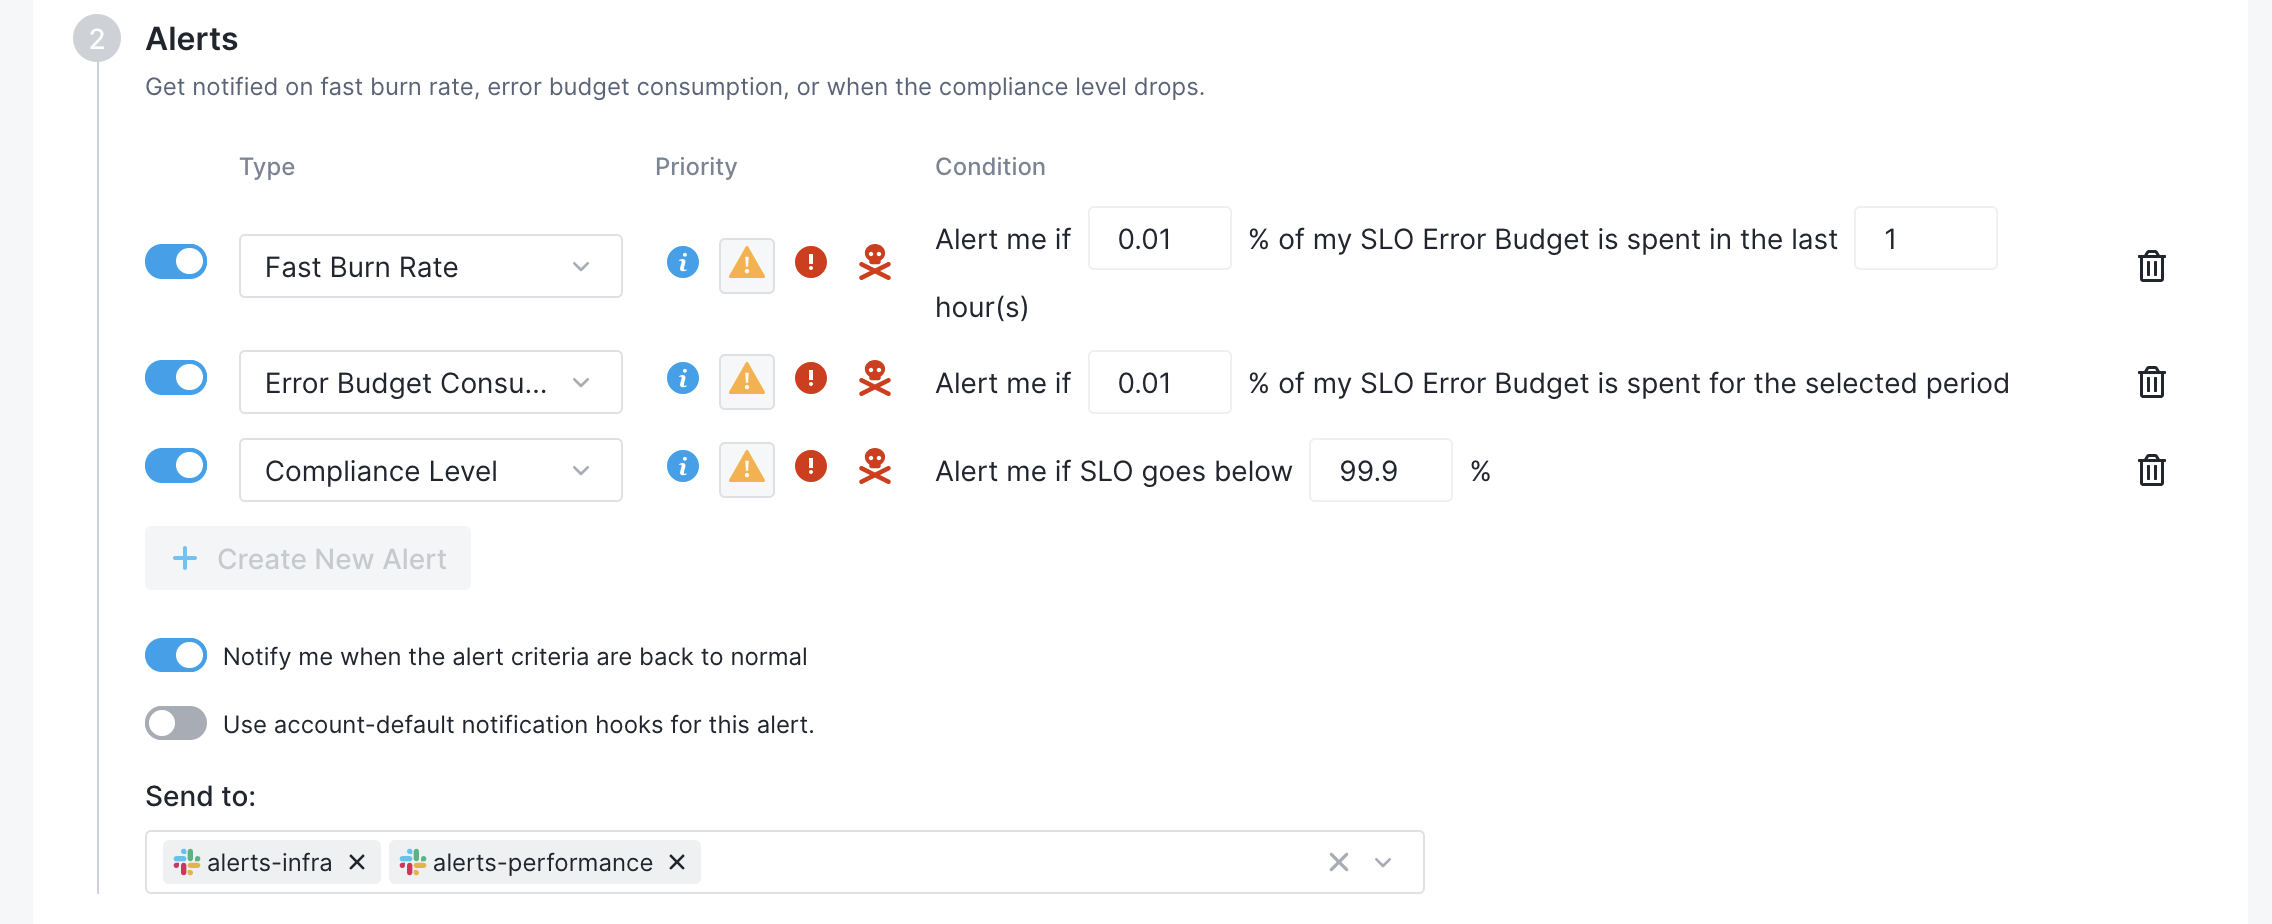
For each SLO you can define zero or more Alert Rules. There are three different alert types to choose from:
- Fast Burn Rate: The high-speed consumption of a service's error budget. It indicates that synthetic monitors are failing rapidly enough to breach your SLO within a short window—usually minutes or a few hours—signaling a severe, active outage.
- Error Budget Consumption: The rate at which your synthetic monitor uses up its allowed downtime or failure limit over a set Compliance Window.
- Compliance Level: The specific time frame (aka Compliance Window) used to evaluate whether an application or service uptime or performance meets an SLO.
You are allowed to create more than one alert of each type for each synthetic monitor.
These Alerts use the existing Alerting Notification Hooks to notify you and you will see these alerts on the existing Alerts and Events screens.
SLO Reports
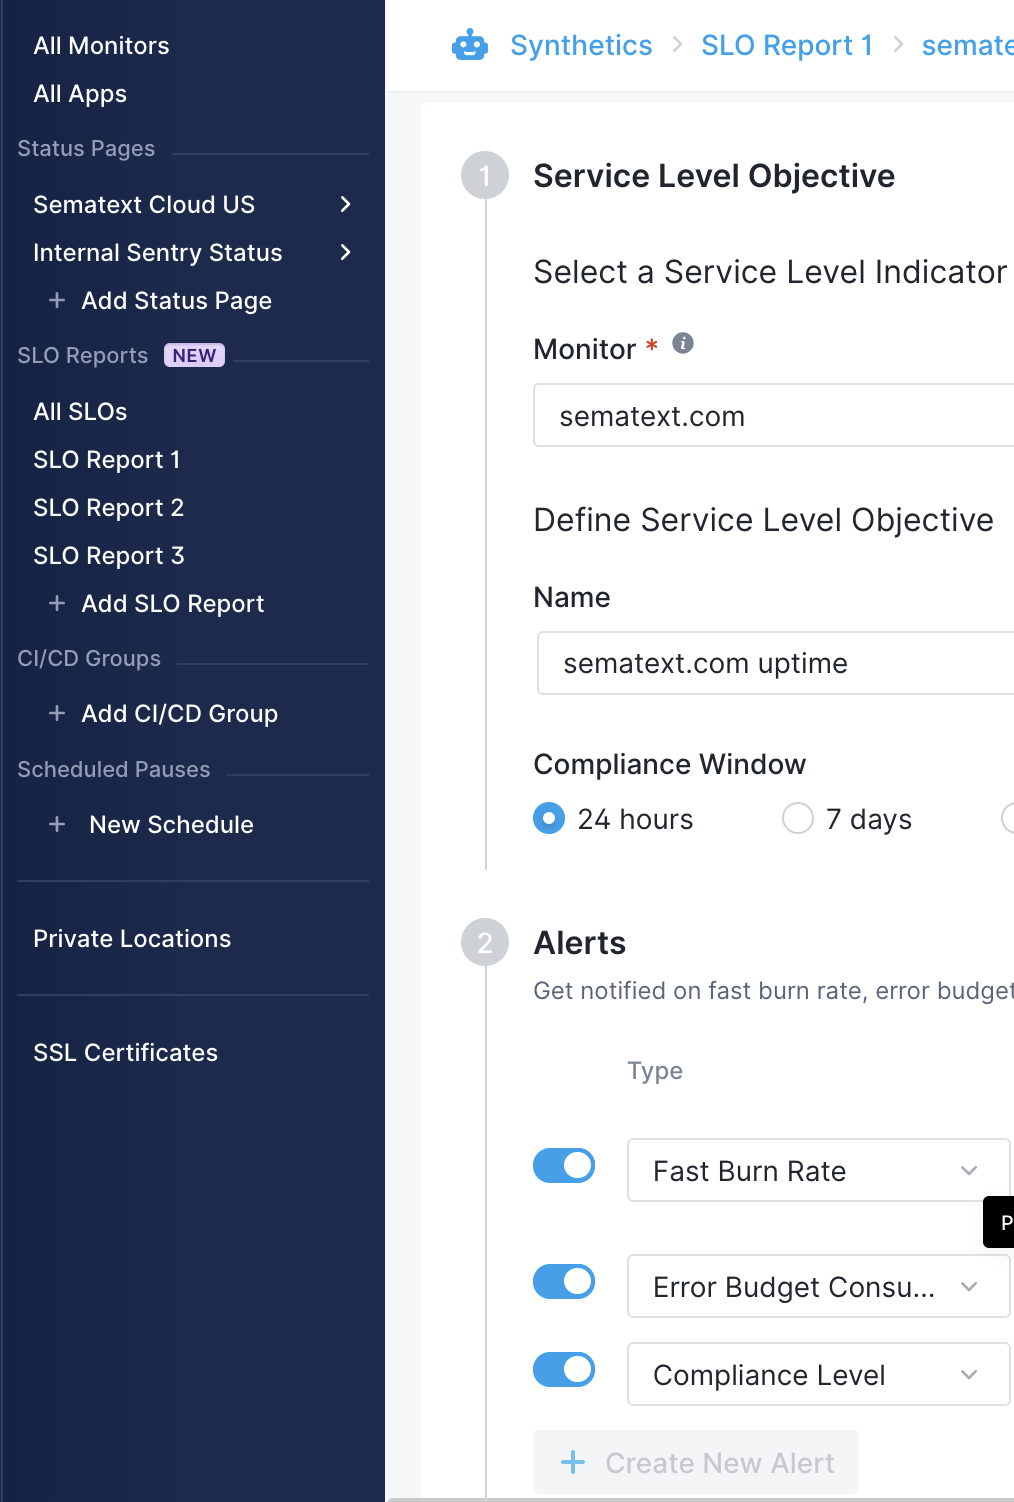
SLOs can be grouped into Reports. Each Report is shown on the left side below All SLOs, which shows all defined SLOs on a single filterable screen.
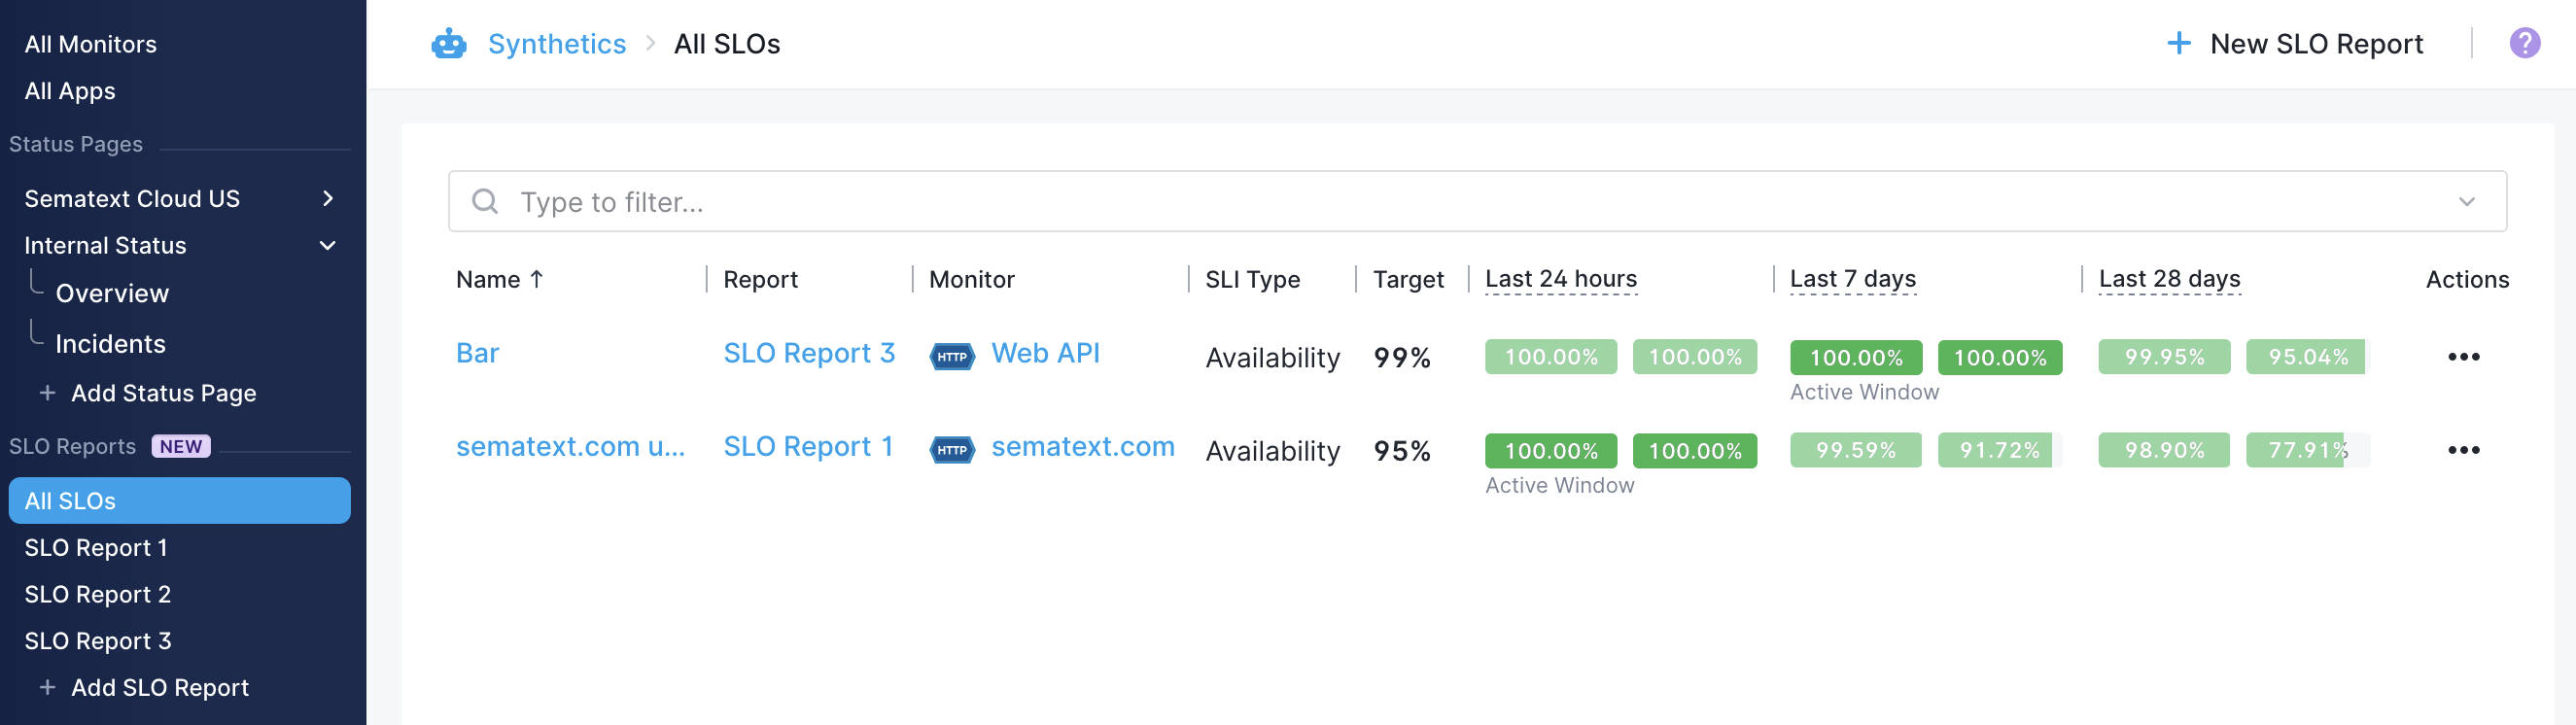
You can create any number of SLO Reports and add any number of SLOs to each Report.
SLO Details
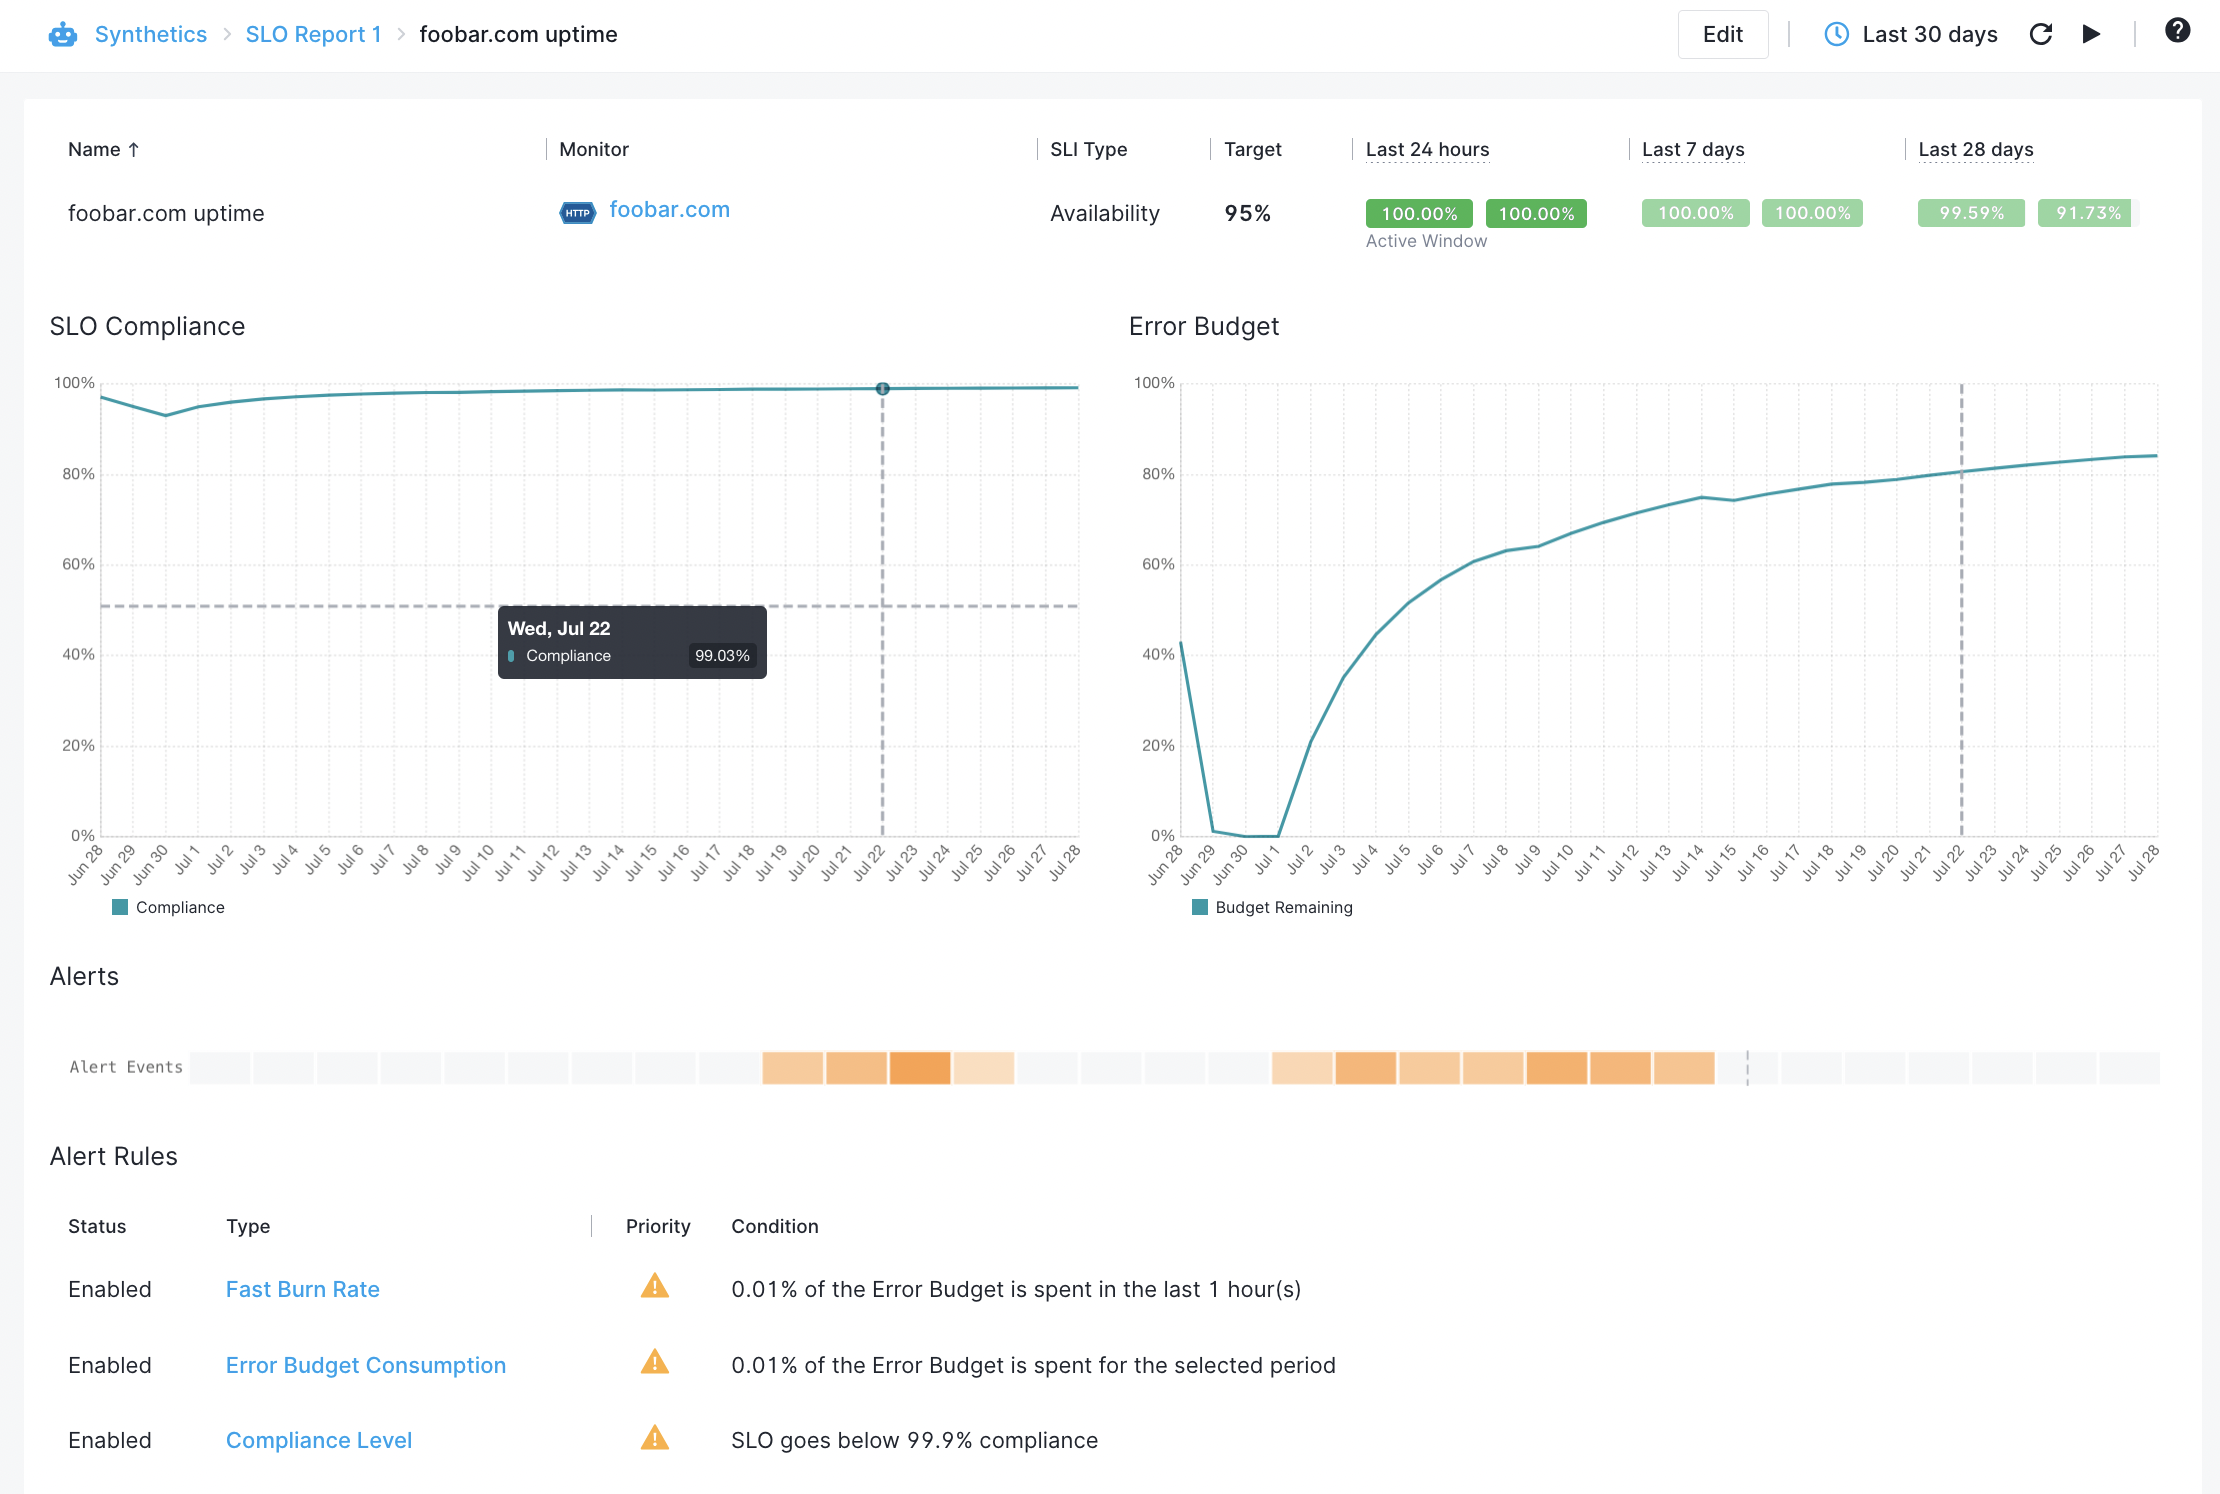
Clicking on a SLO name will take you to a screen with all details for that SLO. This is where you can see the Error Budget and Compliance charts. You can also see a heatbar with all alert events. The more saturated the color of the heatbar the more alerts have been triggered in that period. Clicking on the alert heatbar will show you a full list of triggered SLO alerts for that period.
Accessing SLOs
You can access SLOs via All SLOs screen or any of the optional SLO Reports, all of which are displayed in the left navigation in Sematext Synthetics.
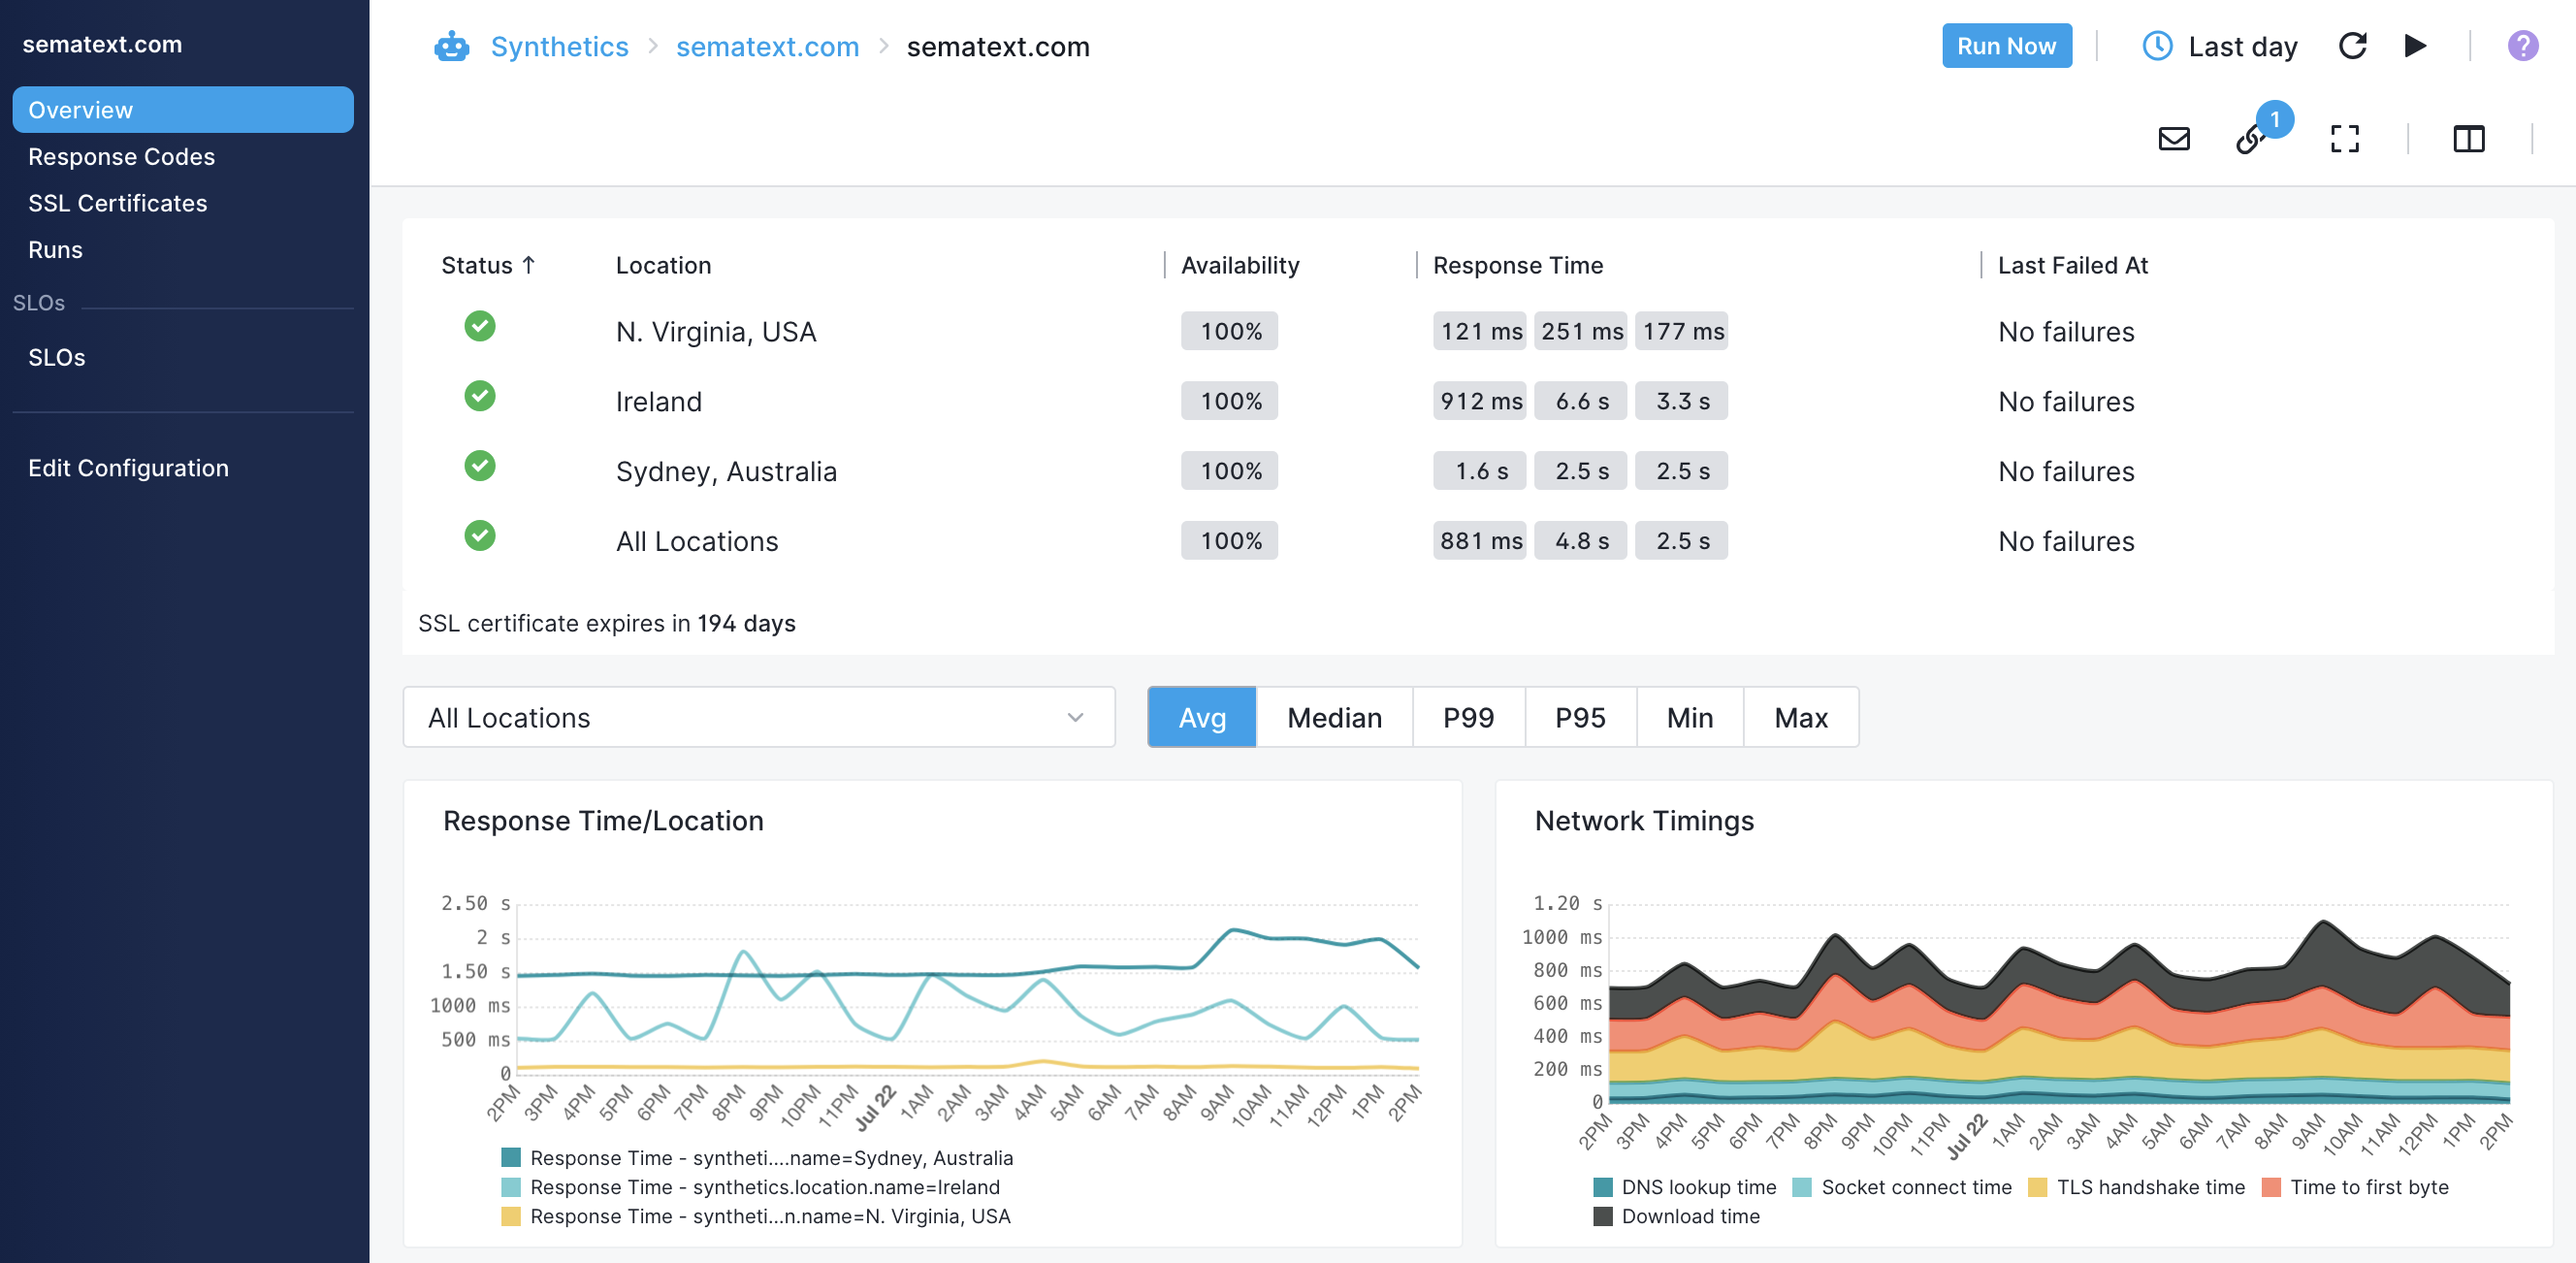
You can also see all SLOs defined for a given synthetic monitor when you are on the screen with all monitor details, as shown below.