Tabular Views
All data visible in the Network Map can also be accessed via alternative non-map interface. There are screens with all discovered services, kubernetes clusters hosts, network connections, and more. All data is neatly tabulated, easily filterable and easily sortable.
Services
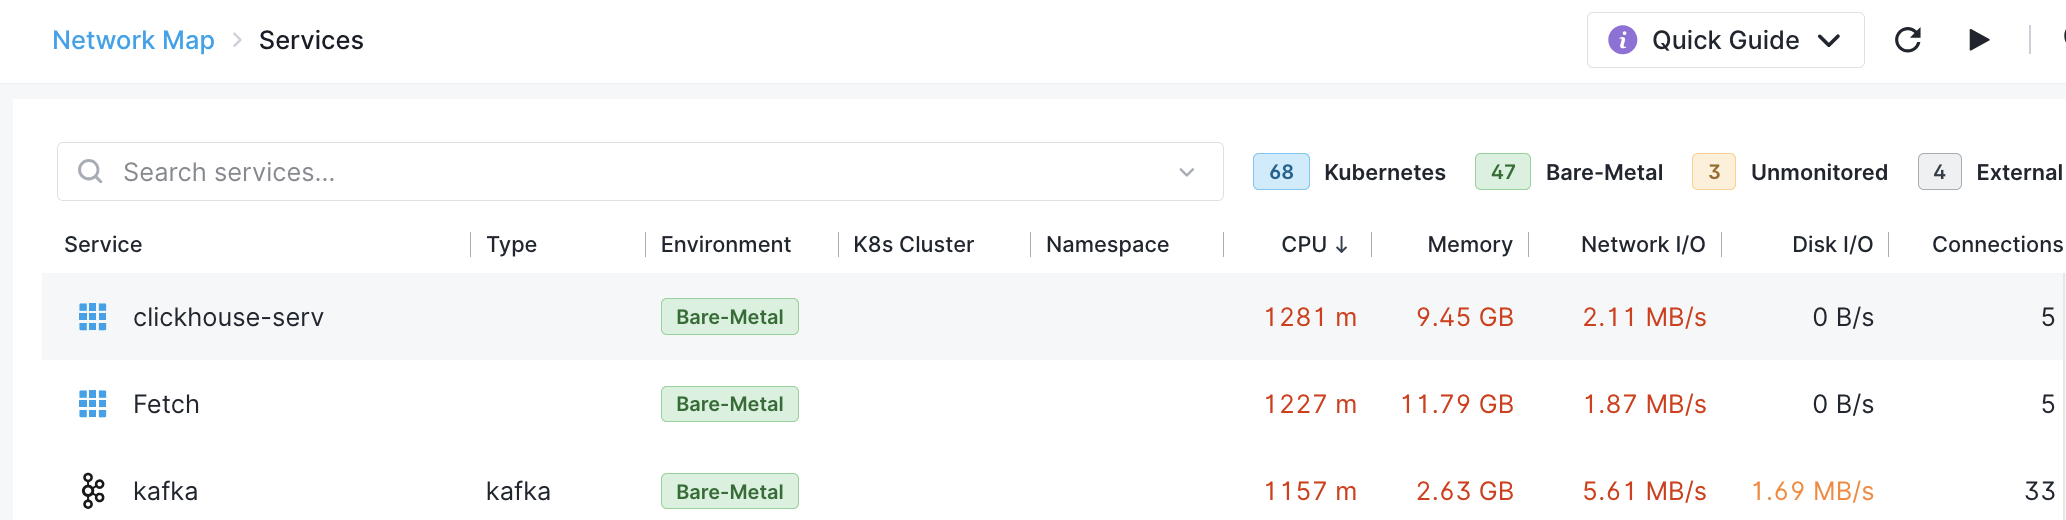
For auto-detected services you can see where each service is deployed, and its key metrics, including the number of network connections.
Hosts
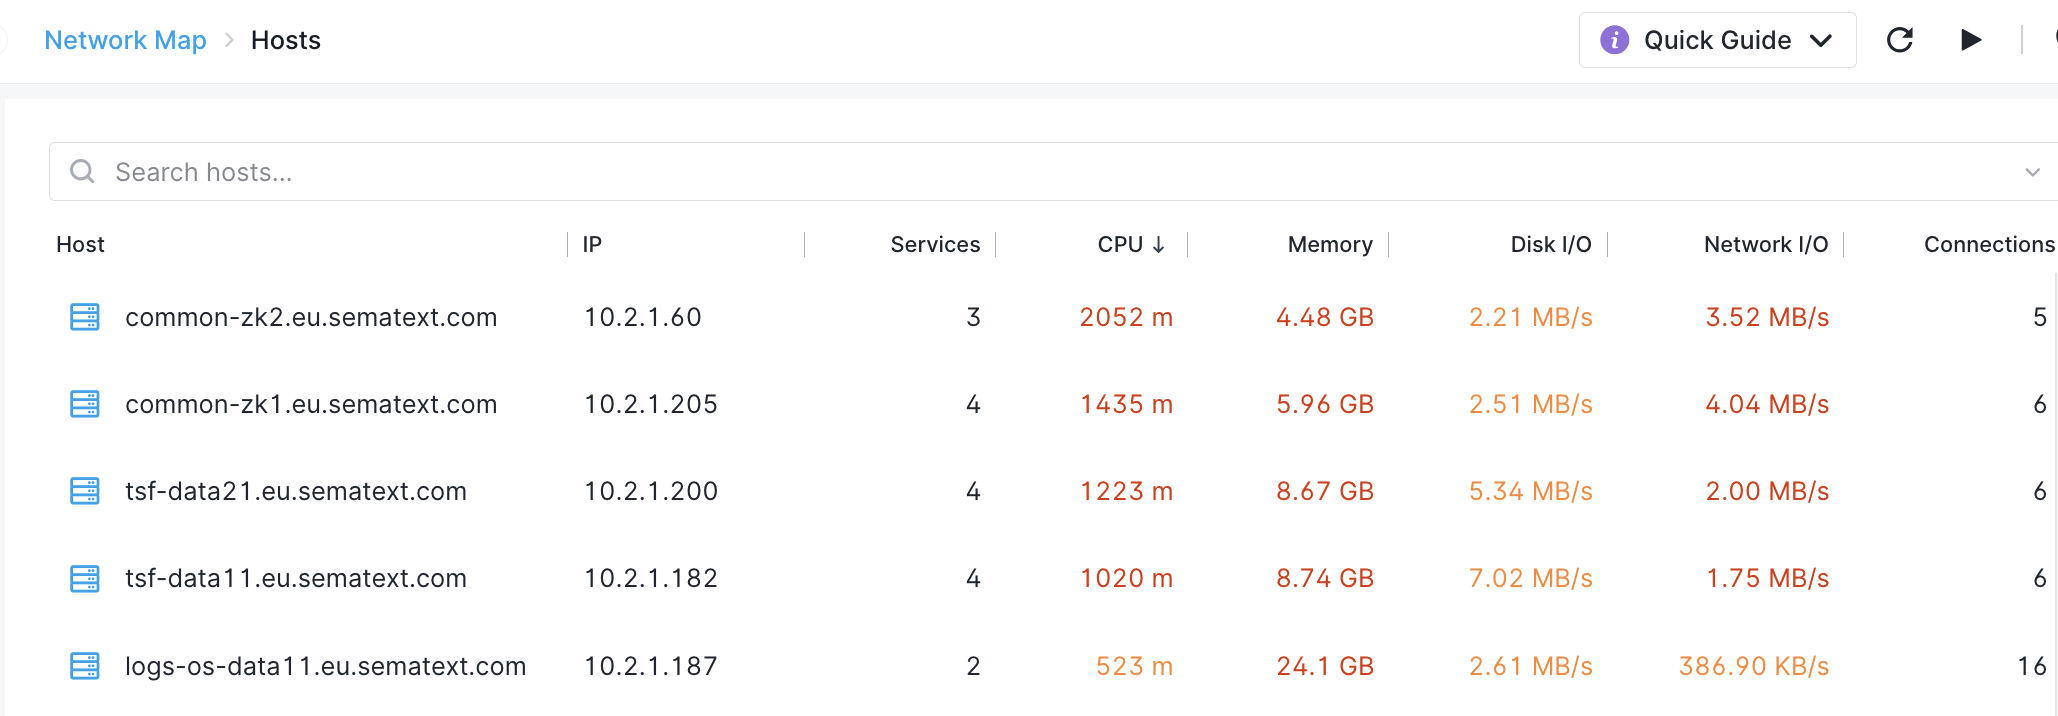
The hosts view shows what you might expect, plus the number of network connections and the number of discovered services.
Kubernetes
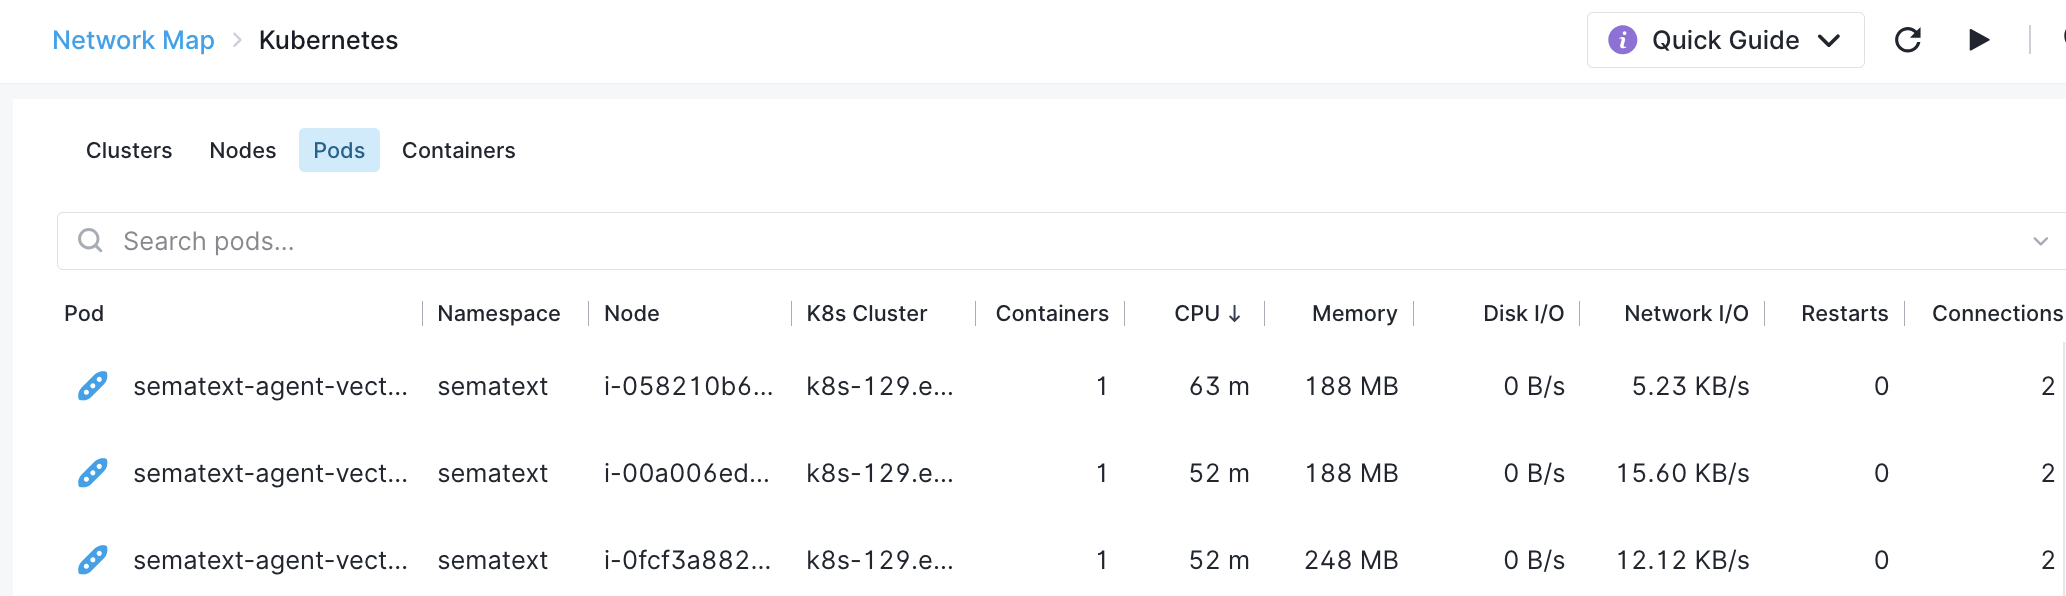
Each Kubernetes cluster is listed separately, allowing you to drill into each cluster’s details individually. You can also see the breakdown by nodes, pods, or containers.
Kubernetes screen additionally has dedicated views for clusters, pods, and underlying containers.
Connections
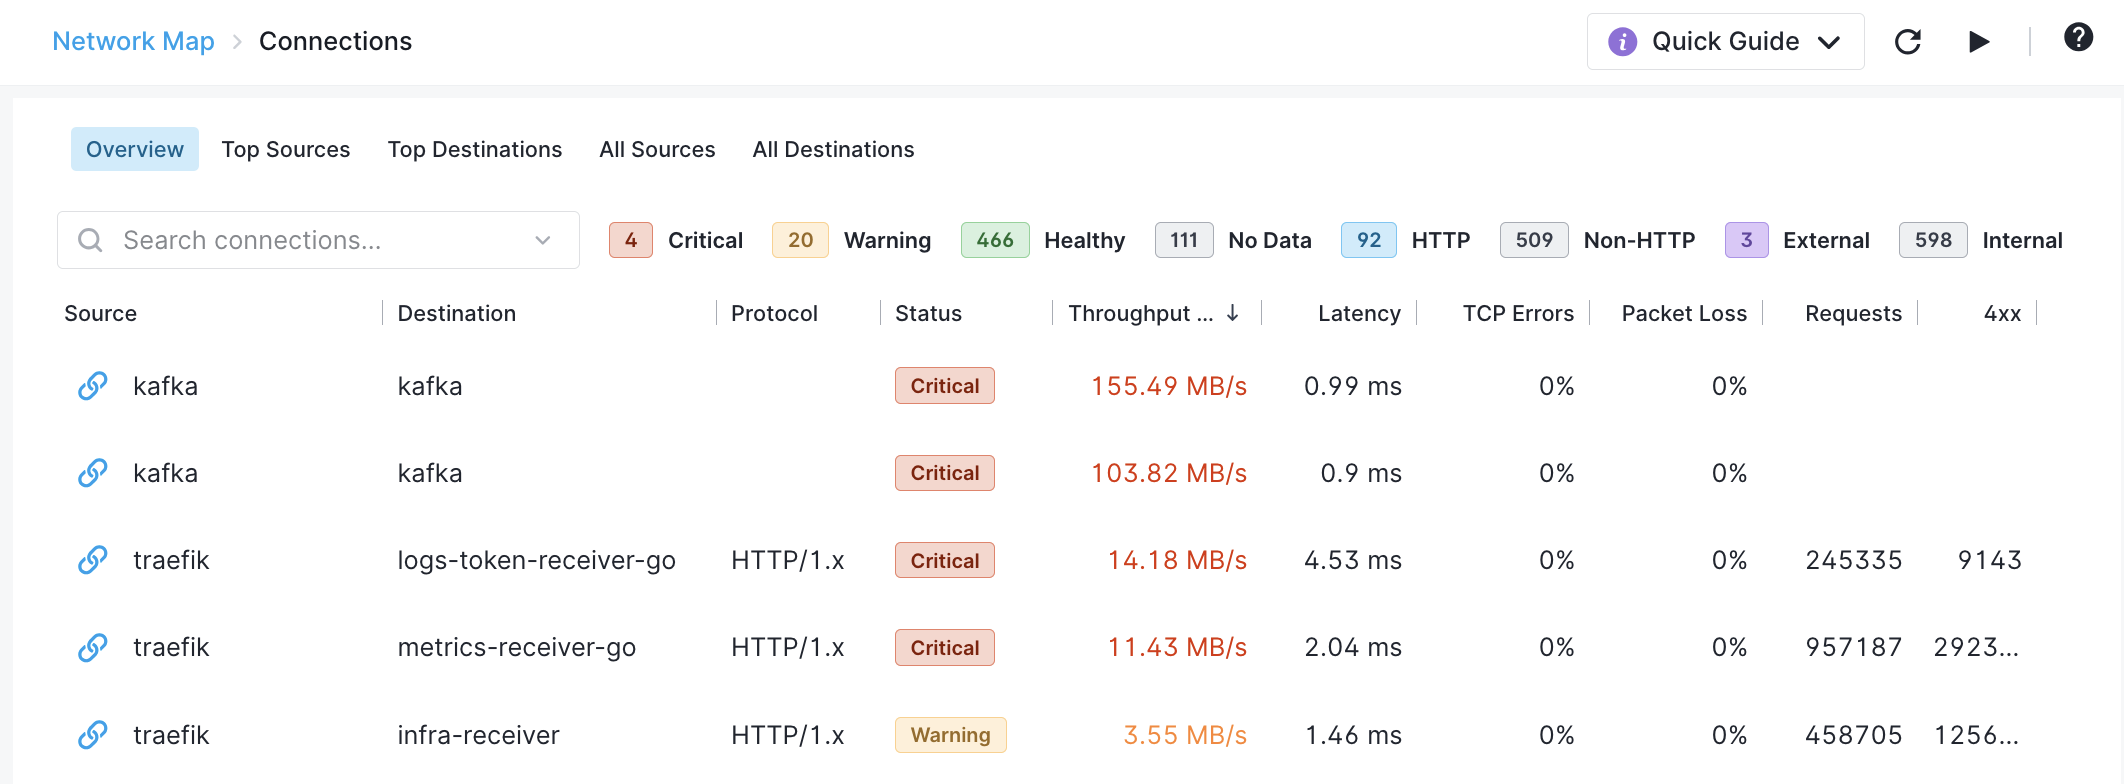
The Connections screen contains the most interesting network-focused details.
For each source-destination network pair you can see the network protocol used, the connection throughput, latency, TCP errors, and packet loss. Additionally, for network connections you will also see the number of 4xx and 5xx response codes. Sorting by those lets you quickly see services with the most errors, likely requiring attention.
The Connections screen additionally includes all network connection sources and destinations, as well as top sources and top destinations, letting you easily find out which services generate or receive the most network traffic.
Details & Cross-Connect
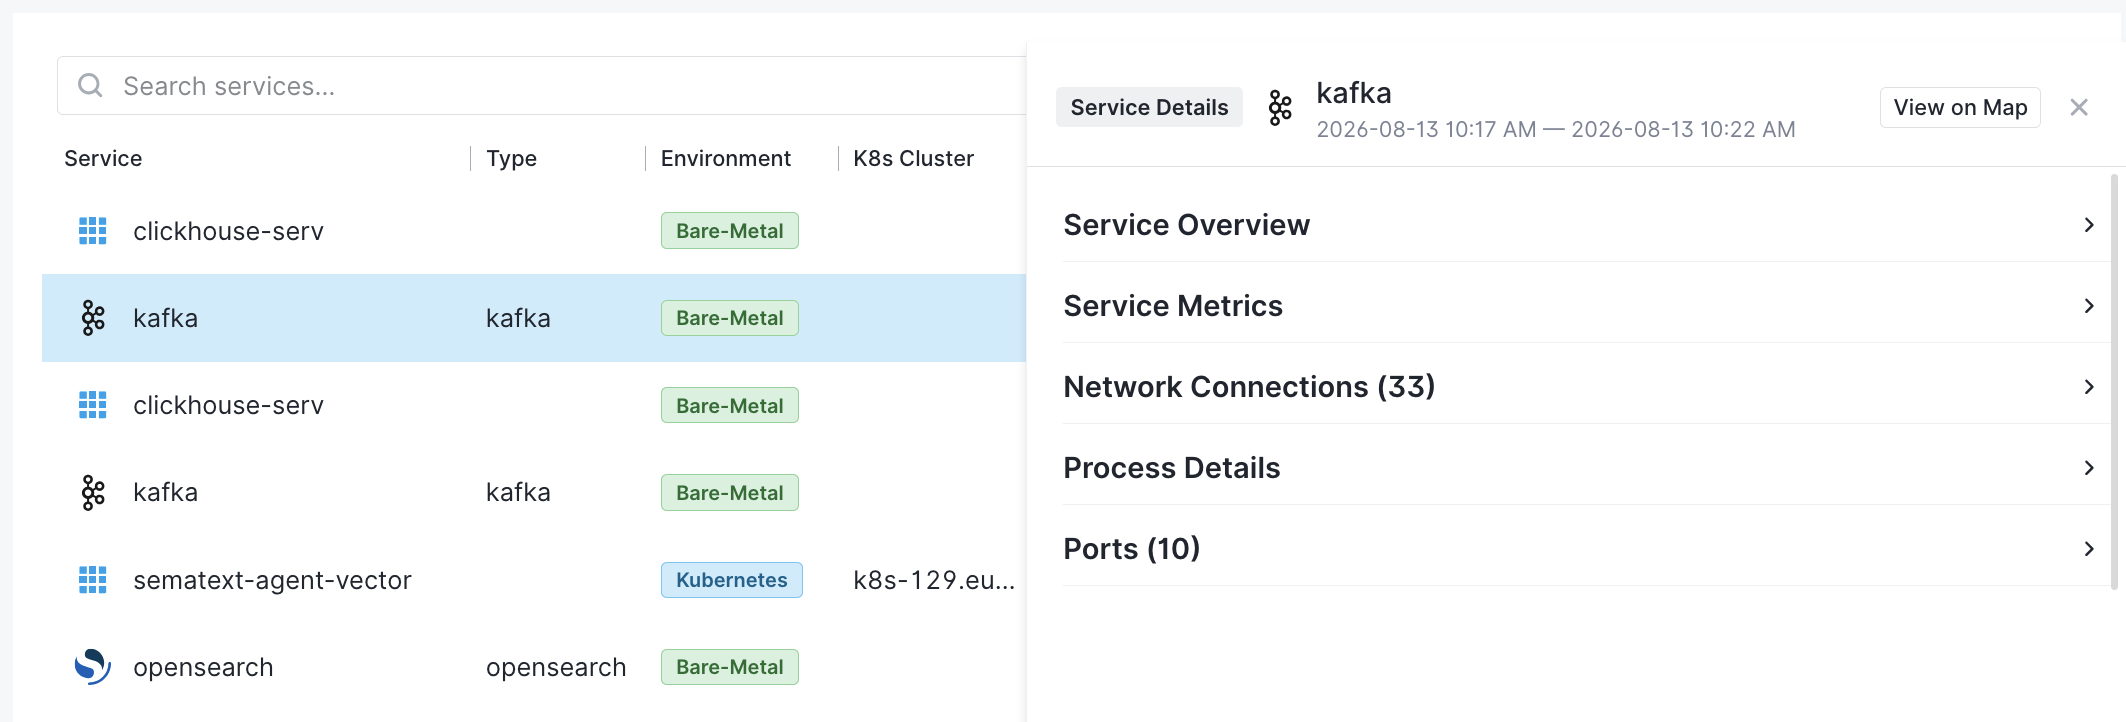
Each row in each view can be clicked to open the side panel with additional details. The details vary depending on the type of entity. From the side panel you can click on “View on Map” to zoom into that item on the Map.